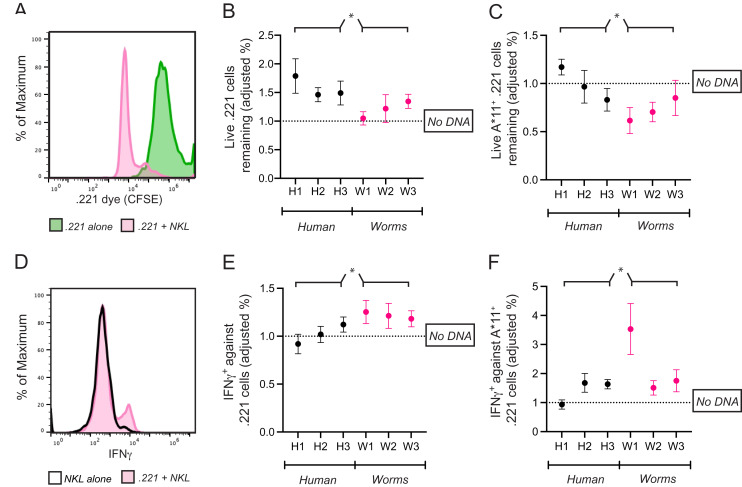
Figure 5. Common CpG+ octamers in the human genome reduce cytolysis and IFN-γ production by KIR3DL2+NKL cells.
(A) Representative FACS plot of CFSE-labeled 721.221 cells in the live gate either alone (green) or in co-culture with KIR3DL2+NKL cells for 2.5 h (pink). (B) KIR3DL2+NKL cells were cultured with CpG+ octamers that are common in the human genome (H1, H2, H3), or the genomes of worms that parasitize humans (W1, W2, W3), or were cultured without exogenous DNA. After four hours, CFSE-labeled 721.221 cells, which lack HLA class I, were added at a 10:1 E:T ratio. Shown is the percentage of live 721.221 cells remaining after 2.5 h of co-culture, divided by the percentage of cells remaining in cultures in which the KIR3DL2+NKL cells were not exposed to CpG+ octamers. Shown are the results of five experiments, and a 2-way ANOVA comparing human and worm octamers. *p-value = 0.04. (C) The same experimental setup as in B, but with HLA-A*11:01+ 721.221 cells. Shown are the results of three experiments, and a 2-way ANOVA comparing human and worm octamers. *p-value = 0.02. (D) Representative FACS plot of IFNγ in live KIR3DL2+NKL cells either cultured alone (black outline), or in co-culture with HLA-A*11:01+ 721.221 cells (pink). (E) KIR3DL2+NKL cells were cultured with or without CpG+ octamers for 4 h as described in A. HLA− 721.221 cells were then added to the cultures at a 10:1 E:T ratio with BFA. Shown is the percentage of live IFNγ+ KIR3DL2+NKL cells 6 h later, divided by the percentage of those in co-cultures that were not cultured with CpG+ octamers. Shown are the results of seven experiments, and a 2-way ANOVA comparing human and worm octamers. *p-value = 0.03. (F) The same experimental setup as in B, but with HLA-A*11:01+ 721.221 cells being added to the KIR3DL2+NKL cells at a 10:1 ratio, instead of 721.221 cells. Shown are the results of four experiments, and a 2-way ANOVA comparing human and worm octamers. *p-value = 0.03.

