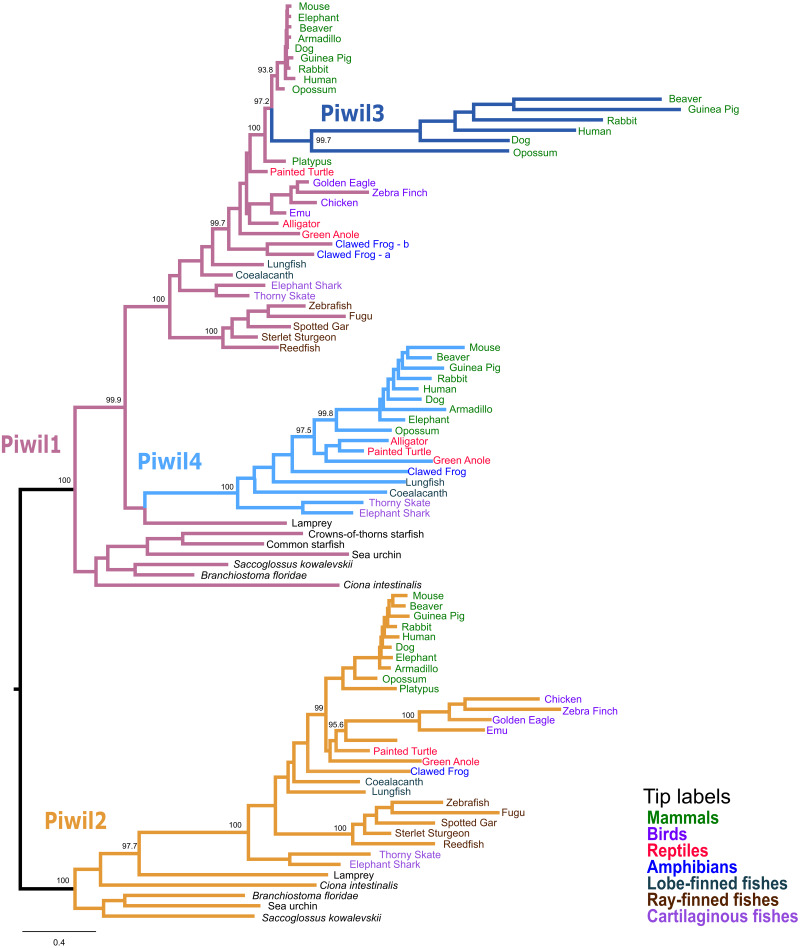
Figure 1. Phylogenetic reconstruction of the vertebrate Piwi family.
A phylogenetic tree constructed from a reduced dataset to summarize relationships among Piwi paralogs. The IQ-Tree2 model chosen was LG+F+I+G4 (LG model using empirical base Frequencies, a proportion of Invariable sites, and a discrete Gamma model with four rate categories). A tree constructed from all species used is presented in Fig. S2. Piwi paralogs are color coded on the tree and tip labels are color coded for major gnathostome groups. The displayed tree was the maximum likelihood tree constructed with IQ-Tree2. Numbers by nodes correspond to support values from the ultrafast bootstrap routine in IQ-Tree2.

