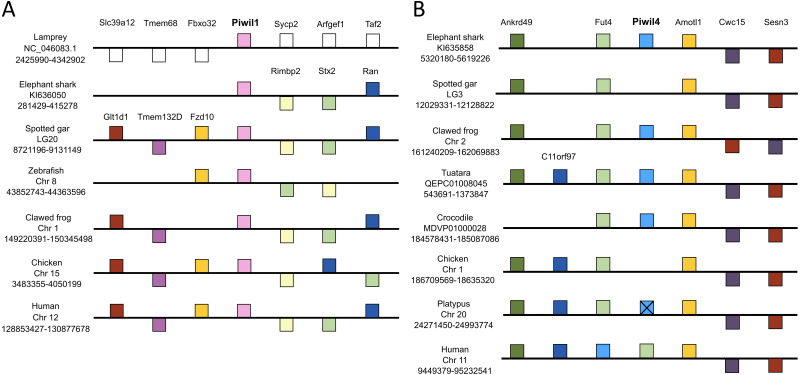
Figure 2. Synteny comparisons of vertebrate Piwil1 and Piwil4.
Organization of genes up and downstream of (A) Piwil1 and (B) Piwil4. Distances are not drawn to scale. White boxes represent genes that are not homologous to any other genes in the synteny block. Boxes on top of the black line reflect genes in forward orientation relative to Piwi genes and boxes below the line are in the opposite orientation. An “X” indicates pseudogenization and empty space between Fut4 and Amotl1 in 2B indicates an absent Piwil4.

