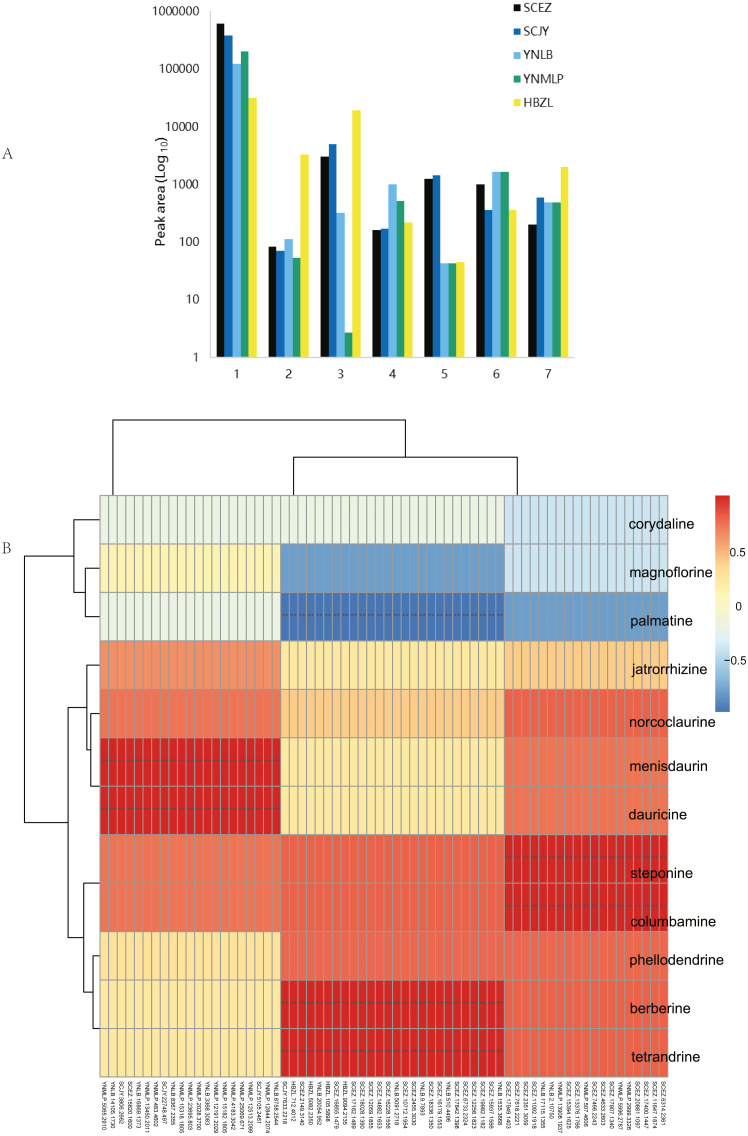
Figure 6. Dichocarpum phytometabolites and gene expression.
(A) Peak areas of Dichocarpum phytometabolites in LC-MS metabolomic analysis. 1, alkaloids; 2, triterpenoids and steroids; 3, flavonoids; 4, organic acids; 5, lactones; 6, saccharides; 7, others. (B) Correlation between BIA content of five Dichocarpum species and gene expression level. **, p < 0.01. Refer to Table S6A for details of the correlated metabolites and genes respectively.

