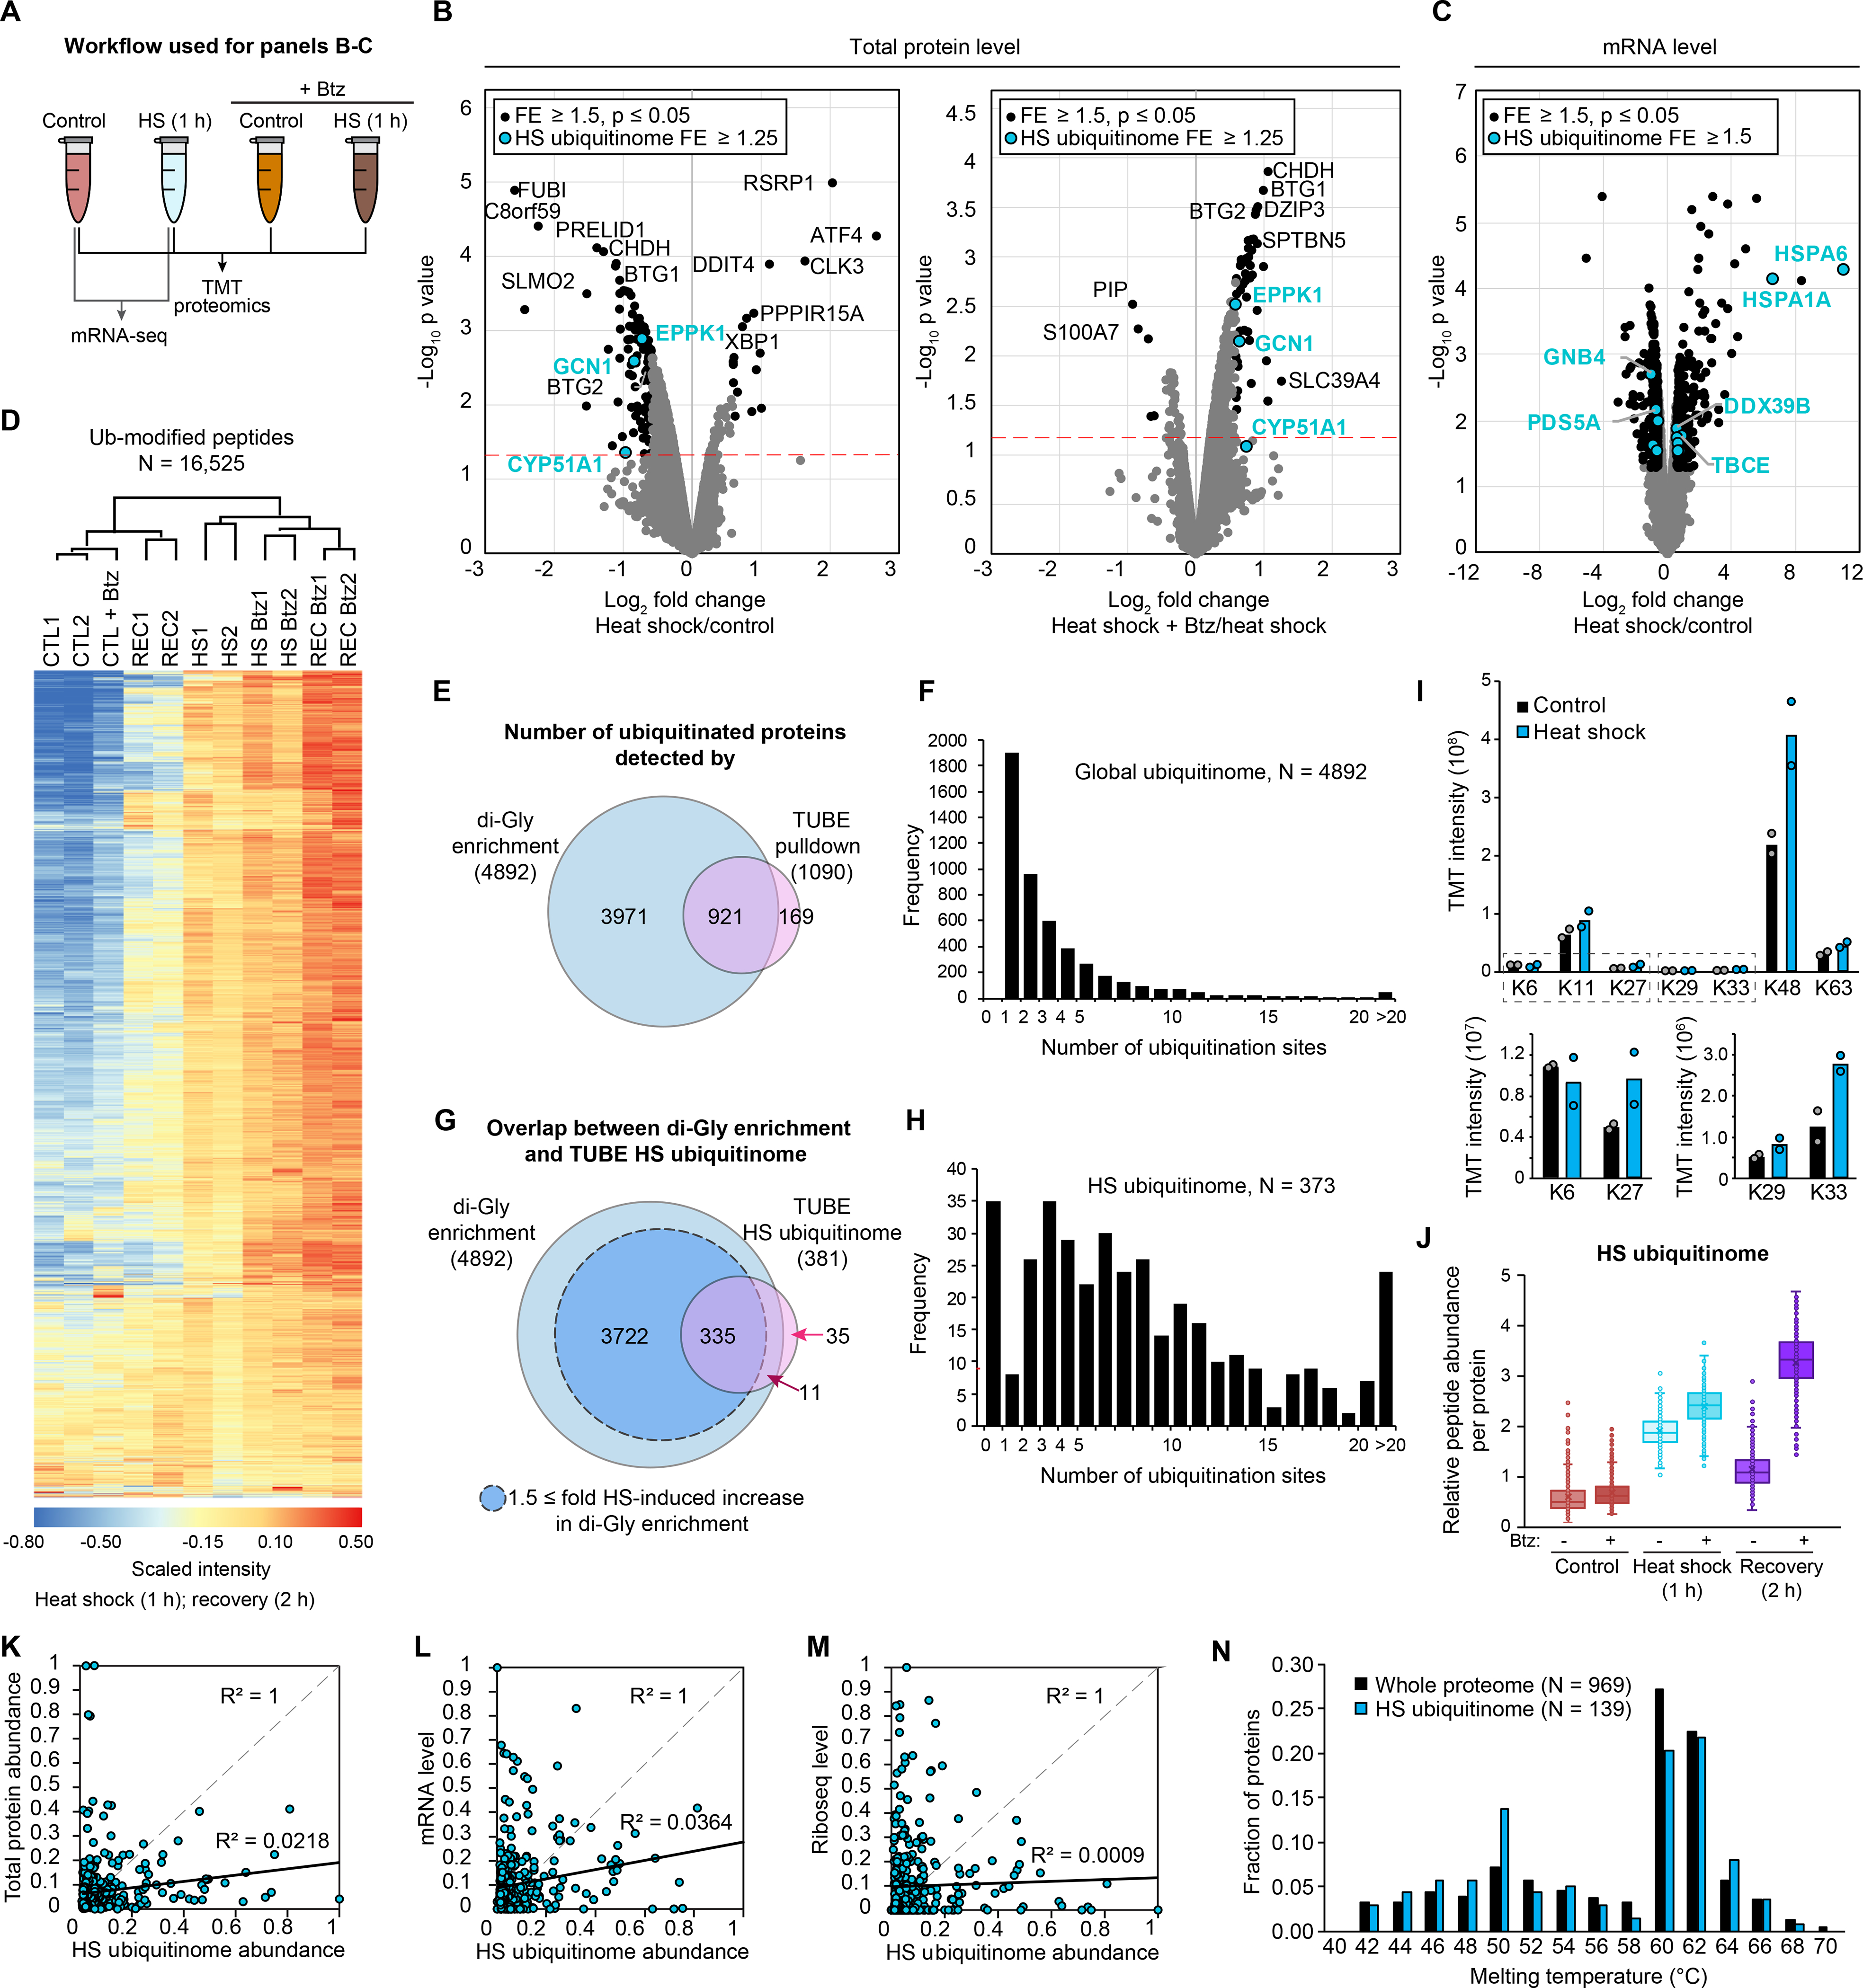
Fig. 3. Proteomic and transcriptomic analyses reveal additional details of the heat shock ubiquitinome.

(A) Workflow for analysis in HEK293T cells. (B-C) Volcano plots indicating (B) changes in protein abundance for heat shock versus control samples (left) and versus heat shock with proteasome inhibitor bortezomib (Btz) (right) and (C) changes in mRNA levels in response to heat shock (C). Statistically significant changes are shown for the whole proteome or transcriptome (black dots) and heat shock ubiquitinome (blue dots). Red dashed lines indicate P = 0.05. (D) Heatmap of changes to the ubiquitinome in HEK293T cells following 1 h heat shock (HS) and 1 h heat shock followed by a 2 h recovery (REC) in the presence or absence of bortezomib as determined by di-GLY profiling. Color indicates scaled TMT intensity. (E) Venn diagram showing overlap of ubiquitinated proteins detected in di-GLY and TUBE experiments. (F) Histogram showing the number of ubiquitination sites per protein detected for all proteins in di-GLY experiments. (G) Venn diagram showing overlap of heat shock-dependent increases in ubiquitination as determined by di-GLY and TUBE experiments. (H) Histogram showing the number of ubiquitination sites per protein for the heat shock ubiquitinome. (I) Bar graphs indicating TMT intensity for each poly-ubiquitin linkage type. Mean and individual values are shown. (J) Box-and-whisker plots showing relative abundance of ubiquitinated proteins for heat shock ubiquitinome proteins. (K-M) Correlation between abundance of heat shock ubiquitinome proteins in TUBE experiments and total protein abundance (K), transcript abundance (L), and ribosome occupancy (M) as determined by Ribo-seq, with R2 values displayed. (N) Histogram showing melting temperatures as determined in reference (54) for all proteins measured (black bars) and measured heat shock ubiquitinome proteins (blue bars).
