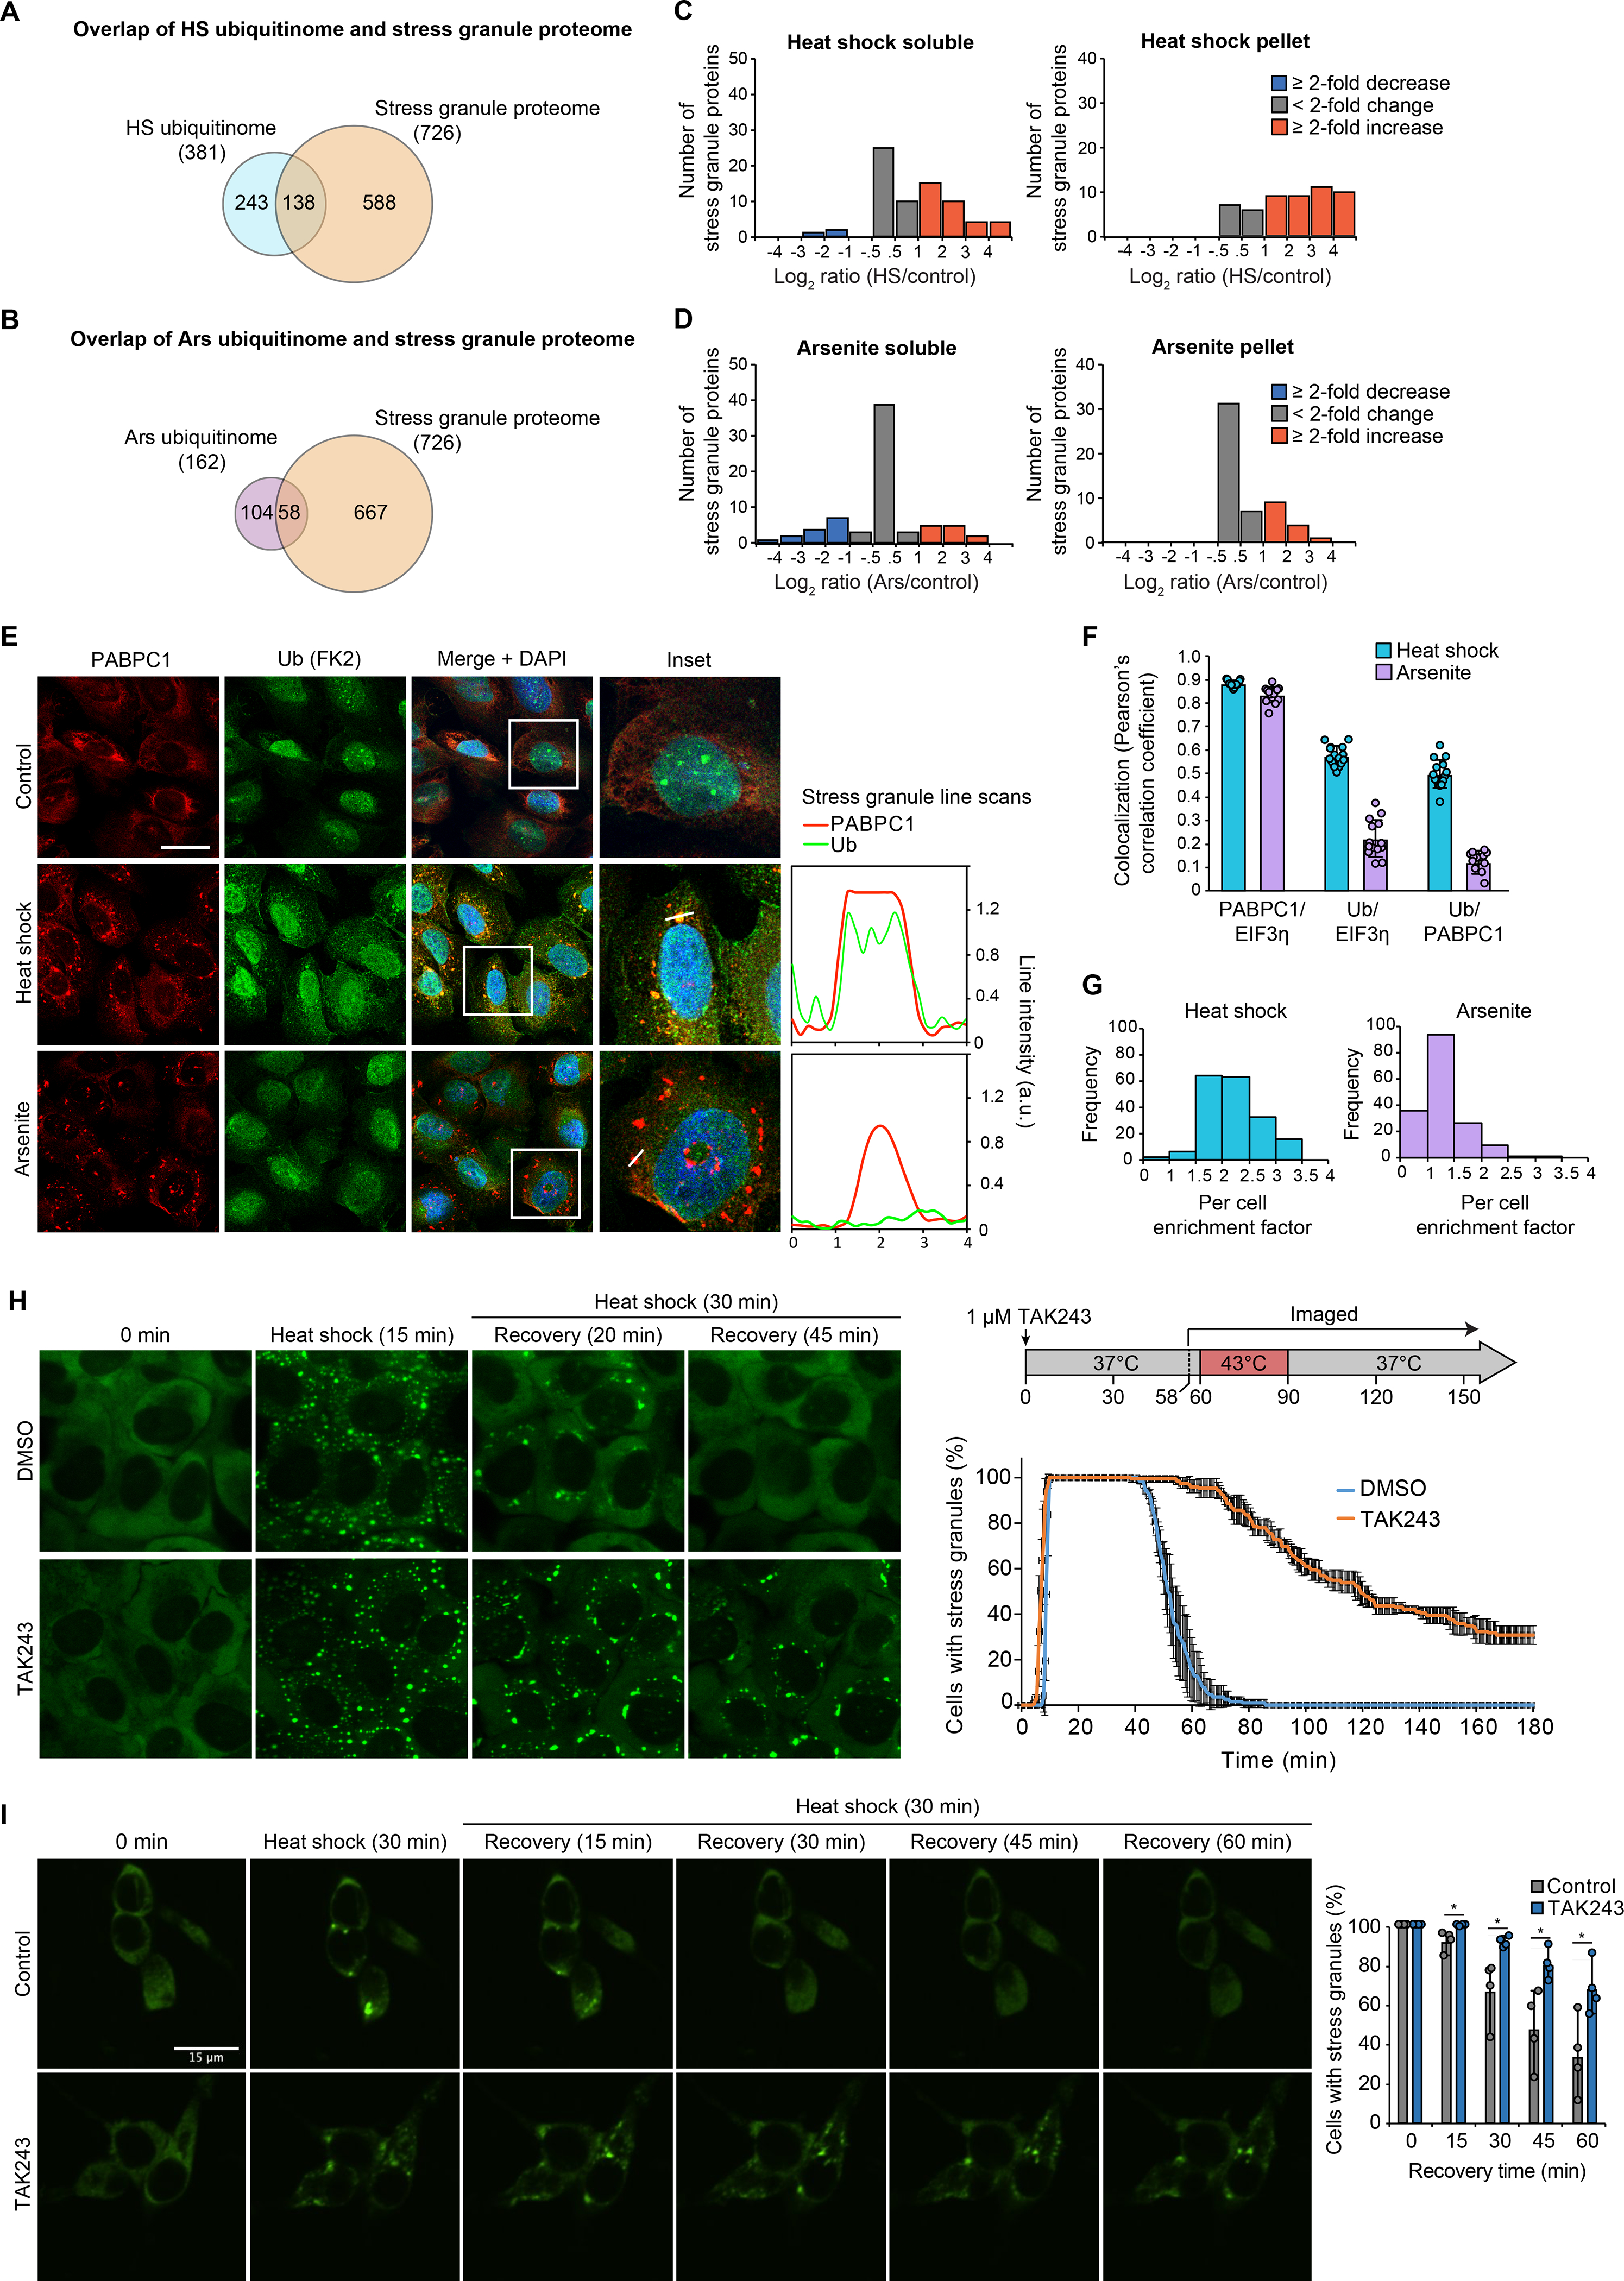
Fig. 6. Heat shock-induced stress granules contain ubiquitinated proteins and require active ubiquitination for disassembly.

(A-B) Overlap of heat shock (A) and arsenite (B) ubiquitinomes of HEK293T cells with the stress granule proteome. (C-D) Histograms showing changes in ubiquitinated protein abundance for high-confidence stress granule proteins in response to 60 min heat shock (C) or 60 min arsenite (D) as determined by TUBE (tables S2 and S5). (E) U2OS cells were exposed to 90 min of sodium arsenite or heat shock, fixed, and stained for stress granule markers PABPC1 (red), EIF3η (not shown), and poly-ubiquitin (FK2, green). Graphs represent a line scan of signal intensity for PABPC1 and FK2 channels across the indicated stress granule. Scale bar, 50 μm. (F) Co-localization between immunofluorescent signal for PABPC1 and EIF3η and poly-ubiquitin as determined images collected as in (E). Bar graphs represent mean (± s.d.) and individual Pearson’s correlation coefficient values for > 10 images (total of > 100 cells for each condition). (G) Histogram of enrichment factor of ubiquitin in stress granules (ratio of the mean intensity of FK2-ubiquitin signal in granules to the mean intensity of the total cell area, excluding granules) for > 100 cells for each condition. (H-I) Live cell imaging of cells stably expressing GFP-G3BP1 during heat stress and recovery in the presence or absence of TAK243 for U2OS cells (H) or iPSC-derived neurons (I). Plots show the percentage of cells with ≥ 2 stress granules at the indicated time, with (H, line graph) solid lines and error bars representing average values and s.d. for three biological replicates with 30–50 cells each and (I, bar graph) mean, data range (error bars in I) and individual values shown for four biological replicates with 48–120 neurons each.
