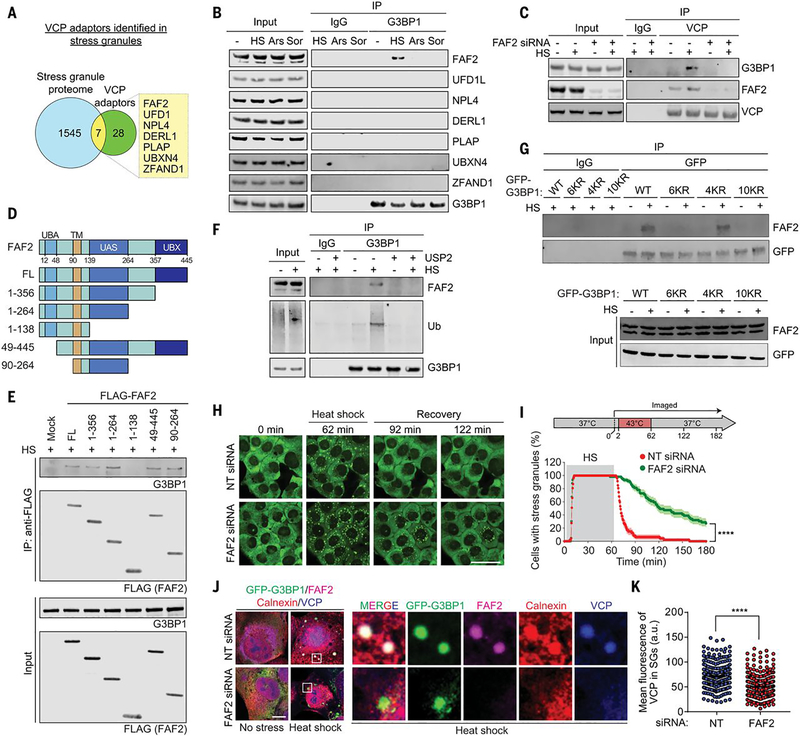
Fig. 5. FAF2 links ubiquitinated G3BP1 to VCP.
(A) Venn diagram showing overlapping proteins among the stress granule proteome and known VCP adaptors. (B) Immunoblot of U2OS cells extracts capture with antibody to GFP exposed to no stress, heat shock (1.5 hours), oxidative stress (sodium arsenite, 1.5 hours), or osmotic stress (sorbitol, 1.5 hours). (C) Immunoblot of U2OS cells extracts captured with antibody to VCP after transfection with NT or FAF2 siRNA and exposure to heat shock for 1.5 hours. (D) Domain structure of human FAF2 protein and deletion constructs used to investigate the function of individual domains of FAF2. UBA, ubiquitin-associated domain; TM, transmembrane domain; UAS, upstream activation sequence domain; UBX, ubiquitin regulatory X domain. (E) Immunoblot of U2OS cells captured with antibody to FLAG exposed to heat shock for 1.5 hours after transfection of FLAG-FAF2 full length (FL) or deletion mutants. (F) Immunoblot of U2OS cells exposed to no stress or heat shock for 1.5 hours. Cell extracts were incubated with or without purified USP2 and captured with magnetic beads conjugated with antibody to G3BP1 for IP, and the resulting beads were analyzed by immunoblot. (G) Immunoblots of U2OS G3BP1/2 dKO cells stably expressing G3BP1 WT, 6KR, 4KR, or 10KR mutants and exposed to heat shock for 2 hours. Cell extracts were captured with magnetic beads conjugated with antibody to GFP for IP. (H) U2OS/GFP-G3BP1 cells were transfected with NT or FAF2 siRNA. Scale bar, 50 μm. (I) GFP signals were monitored at 30-s intervals at 37°C for 2 min, 43°C for 60 min, and 37°C for 118 min to count cells with two or more stress granules from three technical replicates (NT siRNA n = 47, FAF siRNA n = 59). Error bars indicate SEM. ****P < 0.0001 (Mantel-Cox test). (J) Fluorescent imaging of U2OS/GFP-G3BP1 cells exposed to heat shock for 1 hour. Scale bar, 10 μm. (K) Fluorescence intensities of VCP in stress granules from three biological replicates are plotted as mean ± SEM (NT siRNA n = 272, FAF2 siRNA n = 349). ****P < 0.0001 (Student’s t test).

