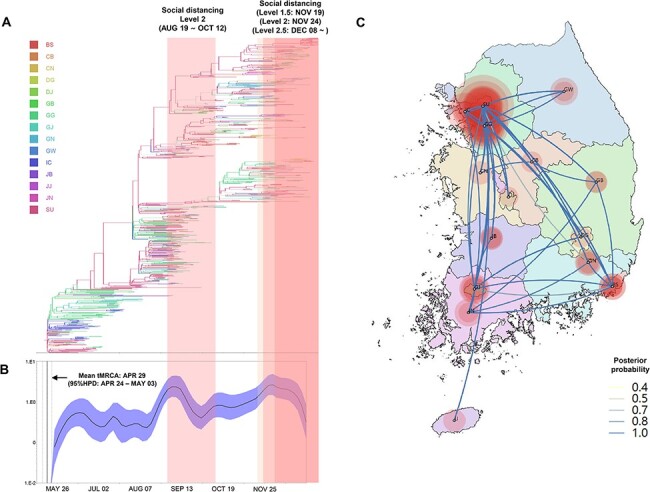
Figure 3.

Phylogeography and effective population size analysis of KR.1 (B.1.497) subgroup viruses. (A) A time-scaled maximum clade credibility tree of the KR.1 subgroup SARS-CoV-2. Branches are colored according to locations in South Korea, and the thickness of branches indicates the posterior probabilities of the inferred ancestral location. (B) Gaussian Markov random field Bayesian Skyride plots indicating effective population size (relative genetic diversity) over time. (C) Spatiotemporal reconstruction of the spread of the KR.1 subgroup SRAS-CoV-2 in South Korea. The diameters of the circles represent the number of branches maintaining a particular location state at each time period. The color of the transmission line represents the posterior possibility of each transmission. BS, Busan; CB, Chungcheongbukdo; CN, Chungcheongnamdo; DG, Daegu; DJ, Daejeon; GB, Gyeongsangbukdo; GG, Gyeonggido; GJ, Gwangju; GN, Gyeongsangnamdo; IC, Incheon; JB, Jeollabukdo; JJ, Jejudo; JN, Jeollanamdo; GW, Gangwondo; and SU, Seoul.
