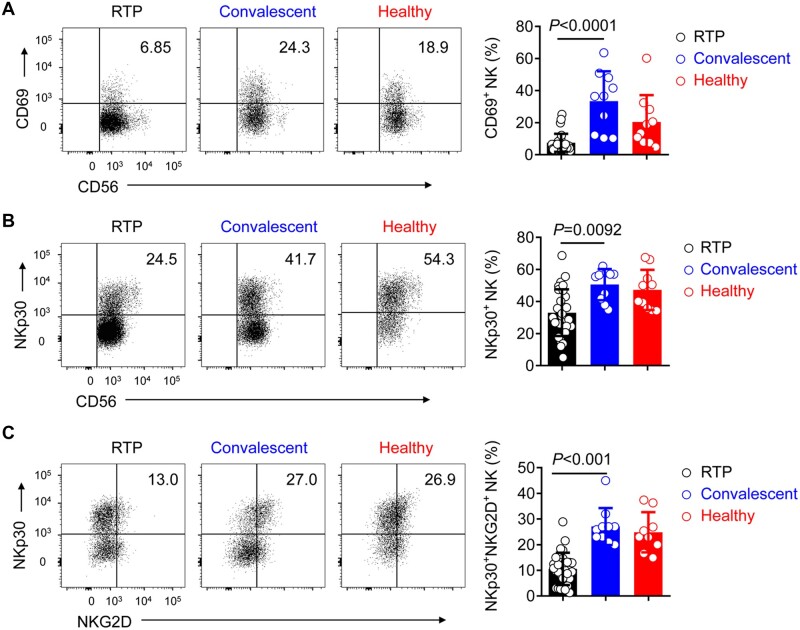
Figure 3.
NK cells maintain low activation in RTP patients. (A and B) Representative density plots and percentage statistics calculated for the expression of CD69 (A) and NKp30 (B) in gated CD45+CD3−CD56+ NK cells isolated from the peripheral blood in RTP patients, convalescent patients, and healthy controls. (C) Representative density plots and percentage statistics calculated for the co-expression of NKp30 and NKG2D in gated CD45+CD3−CD56+ NK cells isolated from the peripheral blood of RTP patients, convalescent patients, and healthy controls. n = 30 for RTP patients, n = 10 (randomly selected from 20 samples) for convalescent patients, and n = 10 (randomly selected from 20 samples) for healthy controls. Data were analyzed by two-way ANOVA. Data are presented as mean ± SD.

