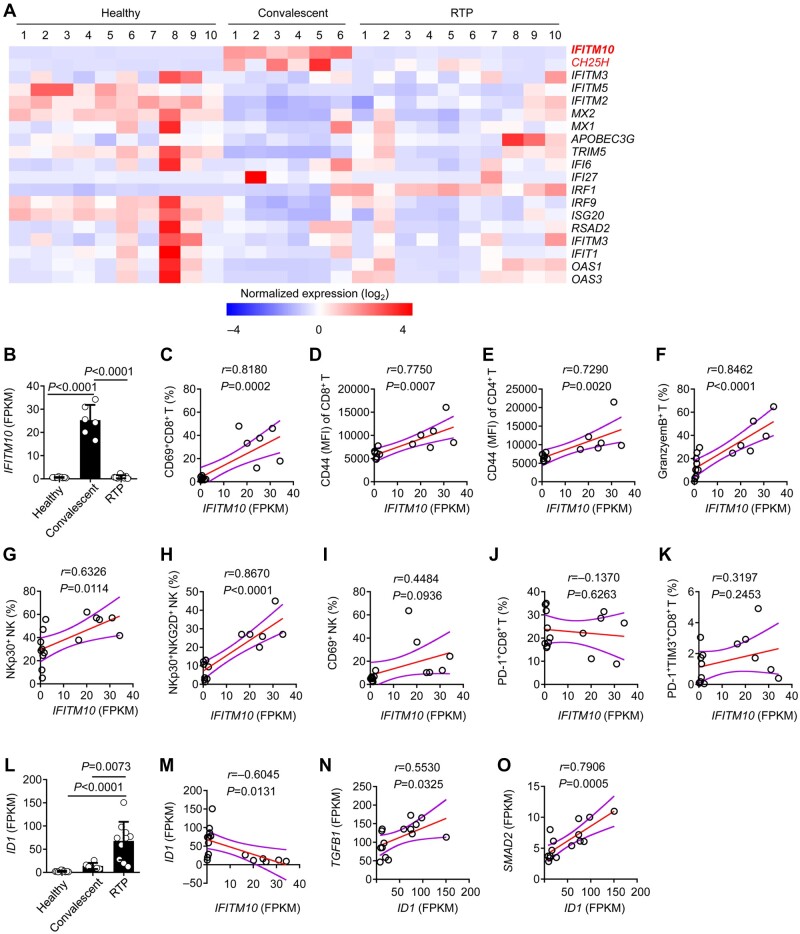
Figure 5.
Leukocytes express IFITM10 at low levels in RTP patients. (A) Heatmap of IFN-stimulated genes with differential expression in RTP patients compared with that in convalescent patients and healthy controls. (B) Fragments per kilobase of exon model per million mapped fragments (FPKM) of IFITM10 in RTP patients compared with that in convalescent patients and healthy controls. (C–K) Spearman’s rank correlation coefficient comparing FPKM of IFITM10 and the proportion of the indicated molecules in RTP patients and convalescent patients. The Spearman correlation coefficient (r) and P-value are shown. (L) FPKM of ID1 in RTP patients compared with that in convalescent patients and healthy controls. (M) FPKM of IFITM10 shows a negative correlation with FPKM of ID1. (N) FPKM of IFITM10 shows a positive correlation with FPKM of TGFB1. (O) FPKM of IFITM10 shows a positive correlation with FPKM of SMAD2. The Spearman correlation coefficient (r) and P-value are shown.

