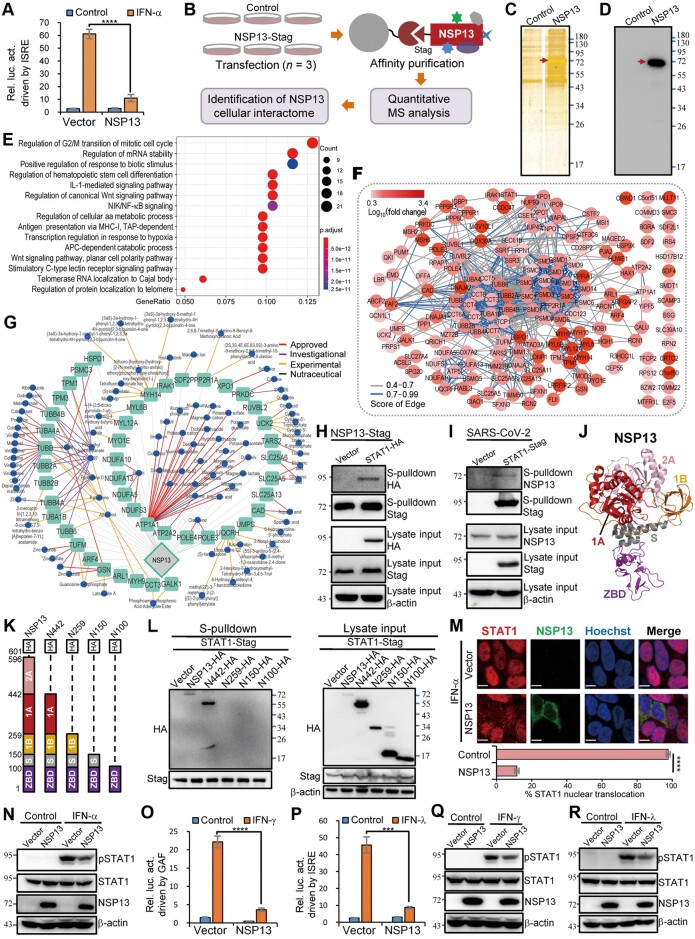
Figure 1.
A new interactome of SARS-CoV-2 NSP13 reveals STAT1 as the cellular interaction target for NSP13 antagonism of IFN signaling cascades. (A) NSP13 suppresses type I IFN-triggered signaling. Dual-luciferase reporter (DLR) assays were conducted as described in Supplementary Materials and methods. Relative luciferase activity (Rel. luc. act.) is shown. (B) Workflow for identifying cellular proteins interacting with NSP13. (C and D) Silver-stained sodium dodecyl sulfate−polyacrylamide gel and immunoblot of control or NSP13 pulldown products. Red arrows indicate efficient precipitation of NSP13. (E and F) Biological process enrichment (E) and STRING analysis (F) for NSP13-interacting proteins (fold change >2, P < 0.05). The top 15 enriched gene ontologies are shown (E). (G) Drug–cellular target network. (H) Validation of NSP13–STAT1 interaction using S-pulldown (NSP13 as bait) and immunoblotting with HEK293T cells. (I) Reciprocal S-pulldown assay using HEK293-ACE2 cells infected with SARS-CoV-2, further corroborating NSP13–STAT1 interaction. S-pulldown assay was performed at 24 h postinfection. (J) 3D structure of NSP13 (PDB: 6ZSL). (K) Linear representation of domain organization in full-length or C-terminal-truncated NSP13 (fused with HA tag). (L) S-pulldown and immunoblotting showing interactions of truncated NSP13 proteins with STAT1 in HEK293T cells. (M) STAT1 nuclear translocation detected using confocal microscopy. At 24 h post-transfection, HEK293 cells transfected with control or HA-tagged NSP13 expression plasmids were treated with IFN-α (2000 U/ml) for 30 min before immunofluorescence assay with anti-HA or anti-STAT1 antibodies; >150 cells for each group were then scored for STAT1 nuclear translocation. Scale bar, 7 µm. (N) HEK293T cells transfected with vector or S-tagged NSP13 expression plasmid were left untreated or treated with IFN-α (2000 U/ml) for 30 min, followed by immunoblotting. (O and P) NSP13 inhibits signal transduction driven by type II (IFN-γ; O) and type III (IFN-λ; P) IFNs. DLR assays for IFN-γ and IFN-λ signaling were performed. (Q and R) Cells were treated as in N, except for replacement of IFN-α by IFN-γ (100 ng/ml) or IFN-λ (200 ng/ml). Data in histograms are mean ± SD, n = 4 (A, O, and P) or 3 (M). ****P < 0.0001, ***P < 0.001. Numbers beside gels or blots indicate molecular mass (kDa).

