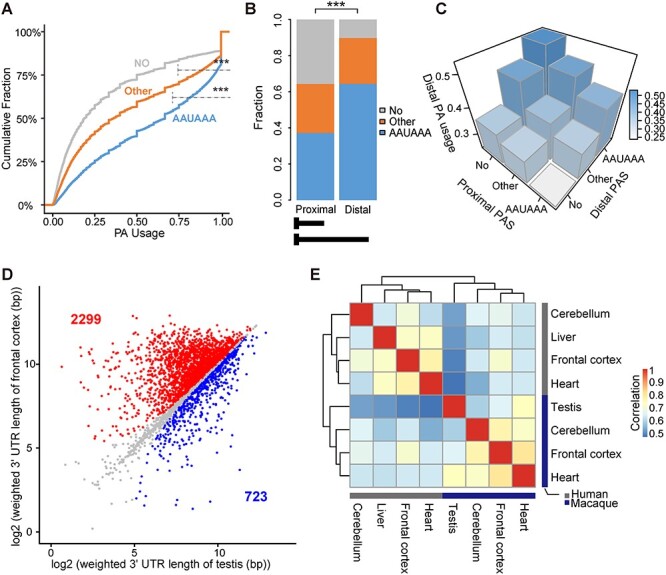
Figure 4 .

Cis- and trans-regulation of PA site selection. (A) Cumulative plots showing the distributions of PA usage in the macaque frontal cortex for three groups of PA sites with different PAS. AAUAAA, PA sites with the canonical PAS AAUAAA; Other, PA sites with other PAS variants excluding AAUAAA; No, PA sites without known PAS. (B) For genes undergoing alternative polyadenylation in the macaque frontal cortex, the proportions of the three groups of PA sites (AAUAAA, Other, No) are shown for the proximal and distal PA sites, respectively. (C) 3D histograms showing average PA usage in the macaque frontal cortex in groups with different combinations of PAS (AAUAAA, Other, No) at proximal and distal PA sites. (D) For each gene expressed in both the macaque frontal cortex and testis, pairwise comparison of the weighted length of the 3′ UTR was performed and shown. The genes with a cross-tissue difference in weighted length of >30 bp are highlighted in red (2299 genes, longer 3′ UTR in frontal cortex) or blue (723 genes, longer 3′ UTR in testis). (E) Hierarchical clustering diagram showing the Spearman correlation coefficients of pairwise comparisons of the PA usage in multiple tissue samples between human and macaque. NS, not significant; *P ≤ 0.05; **P ≤ 0.01; ***P ≤ 0.001.
