Figure 6 .

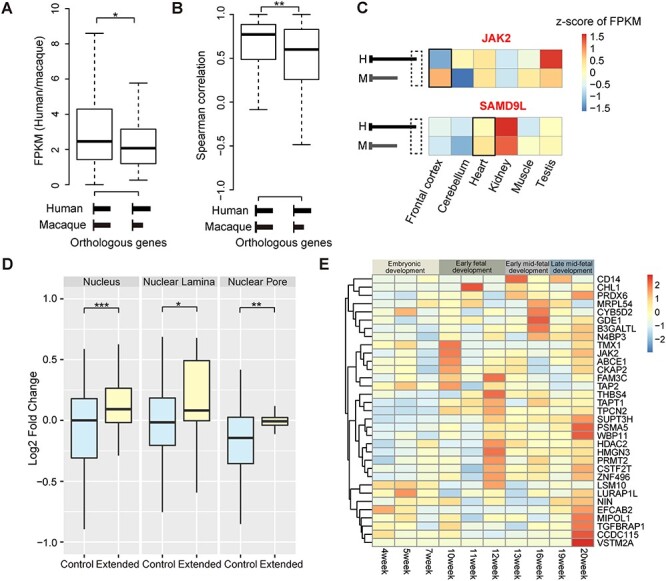
Transcriptome evolution in primates through PA site selection. (A) The ratios of FPKM between human and macaque are shown and compared for orthologous genes with (right boxplot) or without (left boxplot) distal PA sites specific in human but not macaque. (B) Boxplots showing Spearman correlation coefficients of tissue expression profiles in six tissues (frontal cortex, cerebellum, heart, kidney, muscle and testis) of human and macaque for orthologous genes with (right boxplot) or without (left boxplot) specific distal PA sites in human but not macaque. (C) Examples of genes with specific distal PA sites in human but not macaque that also exhibit divergence of tissue expression profiles. The specific tissues in which the human-specific distal PA site was initially identified were labeled by a black box in the heat maps; H, human; M, macaque. (D) Boxplots of the APEX-Seq fold changes for the extended 3′ UTR regions specific to human (Extended) and the constitutive exonic regions of the corresponding genes (Control); NS, not significant; *P ≤ 0.05; **P ≤ 0.01; ***P ≤ 0.001. (E) Heatmap showing the relative levels of the isoforms with newly originated distal PA sites in human, during the human fetal brain development.
