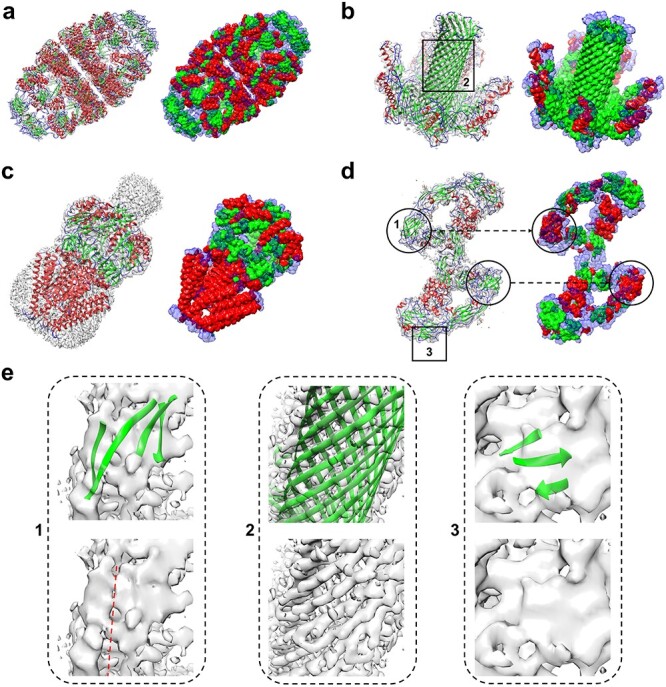
Figure 7 .

Examples of the secondary structure assignment by EMNUSS for high-resolution experimental maps, where helices, strands and coils are colored in red, green and blue, respectively. The raw EM density map in transparent gray is overlapped with the deposited PDB structure on the left, and the annotated map predicted by EMNUSS is on the right. Predicted coil regions (Others) are shown in transparency style. (A) EMD-9195 (PDB 6MRC). (B) EMD-4789 (PDB 6RB9). (C) EMD-4919 (PDB 6RLD). (D) EMD-20579 (PDB 6Q2S). (E) Enlarged view of  -sheet regions. Each subfigure corresponds to the region in black box with the same ID on (B) or (D). The density volume of
  -sheet 1 is broken along the red dotted line.
