Figure 9 .

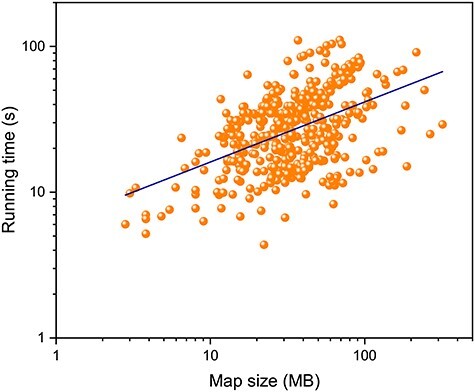
Running time of EMNUSS as a function of the map size on the high-resolution set in double logarithmic coordinates, where the power–law function regression line is shown in navy blue.

Running time of EMNUSS as a function of the map size on the high-resolution set in double logarithmic coordinates, where the power–law function regression line is shown in navy blue.