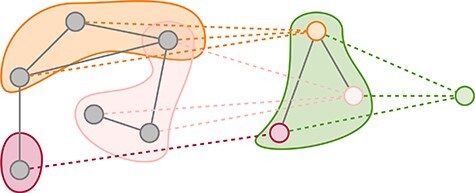
Figure 5 .

A possible graph pooling schematic. Nodes in the original graph (left, grey) are pooled into nodes in the intermediate graph (centre) as shown by the dotted edges. The final pooling layer aggregates all the intermediate nodes into a single representation (right, green). DiffPool could produce the pooling shown [95].
