
Figure 6 .
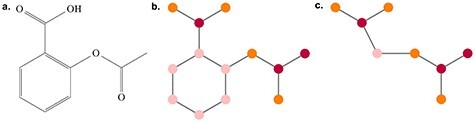
Illustration of (A) the molecule aspirin, (B) its basic graph representation and (C) the associated junction tree representation. Colours on the node correspond to atom types.
Official websites use .gov
A
.gov website belongs to an official
government organization in the United States.
Secure .gov websites use HTTPS
A lock (
) or https:// means you've safely
connected to the .gov website. Share sensitive
information only on official, secure websites.
Illustration of (A) the molecule aspirin, (B) its basic graph representation and (C) the associated junction tree representation. Colours on the node correspond to atom types.