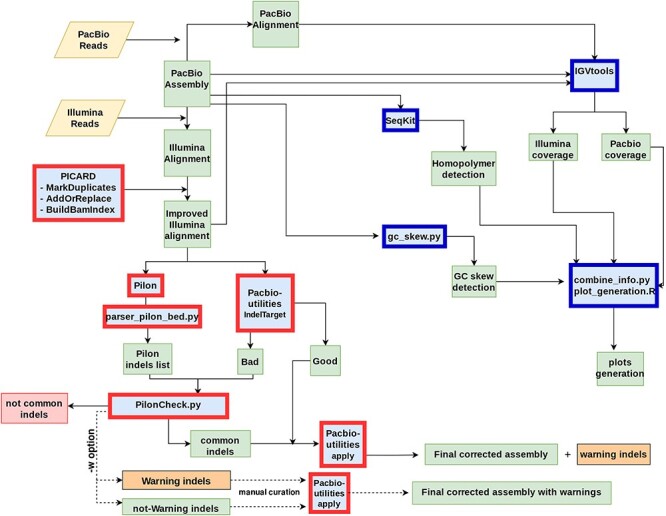
Figure 1 .

Schematic overview of the workflow leading to the correction of PacBio-only genome assembly. Input files (Raw Reads) are represented as yellow rhomboids. All the different software is shown in blue boxes. Those tools implemented in the Correction_step of ARAMIS are shown with red borders. Dark-blue borders show the set of tools used by the Statistical_step of ARAMIS. Those common indels in which the pipeline is unable to determine the correct sequence are flagged as warnings (orange boxes) for posterior manual curation (−w option). This additional step, outside the main pipeline, is represented with a dashed line. Output files are represented in green boxes. Discarded data are shown in red boxes.
