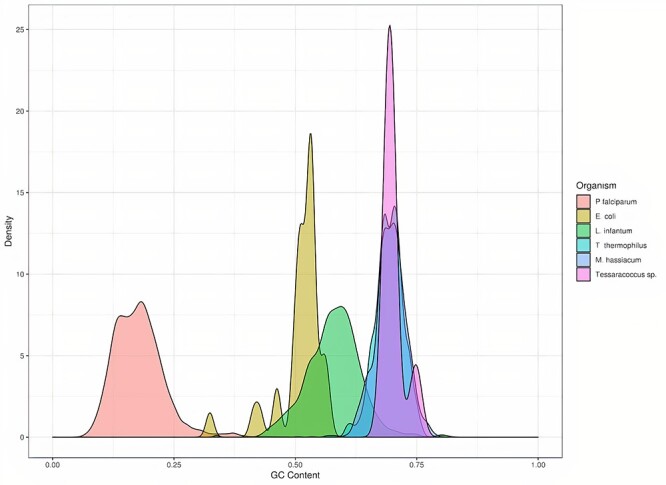
Figure 3 .

KDE plot of indels detected based on the genome GC content. P. falciparum, E. coli, L. infantum, T. thermophilus, M. hassiacum and Tessaracoccus sp. are represented in red, yellow, green, light-blue, dark-blue and pink curves, respectively.
