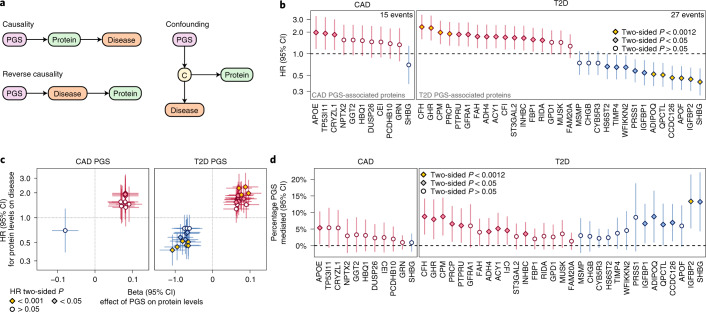
Fig. 2. PGS-associated proteins influence 7.7-year risk of CAD and T2D.
a, Possible models of causality for PGS–protein–disease associations. C, causal disease factor upstream of the protein that induces a correlation between protein levels and disease. b, Association of PGS-associated proteins with 7.7-year risk of hospitalization with CAD or T2D in n = 3,087 INTERVAL participants in Cox proportional hazards models adjusting for age, sex, sample measurement batch and time between blood draw and sample processing. The data shown correspond to the HR for CAD or T2D conferred per s.d. increase in protein levels (points) and its 95% CI (vertical bars). P < 0.0012 indicates that the association was significant after Bonferroni correction for the 42 tests. c, Comparison of associations between protein levels and the CAD PGS or T2D PGS from Fig. 1b (x axes) to HRs for protein levels for 7.7-year risk of hospitalization with CAD or T2D from Fig. 2b (y axes). Beta estimates (points; x axes) correspond to s.d. change in protein levels per s.d. increase in CAD PGS or T2D PGS in the linear regression described in Fig. 1b. HRs (y axes) are as described in b. Linear regression and Cox proportional hazards models were fitted in the same n = 3,087 samples. The point shape and colour correspond to the P value in b. d, Percentage of PGS–disease association mediated by each protein in causal mediation analysis in n = 3,087 INTERVAL participants adjusting for age, sex, ten genotype principal components, sample measurement batch and time between blood draws. The data shown are the percentage of association between the PGS and hospitalization with CAD or T2D after 7.7 years of follow-up in Cox proportional hazard models mediated by each respective protein (points) and the 95% CI of this percentage (vertical bars). Proteins are ordered from left to right by their HR in Fig. 1b and coloured red where protein levels increased with PGS or blue where protein levels decreased with PGS in Fig. 1b. P < 0.0012 indicates that mediation was significant after Bonferroni correction for the 42 tests. Full summary statistics including exact two-sided P values for b–d are detailed in Extended Data Fig. 3.

