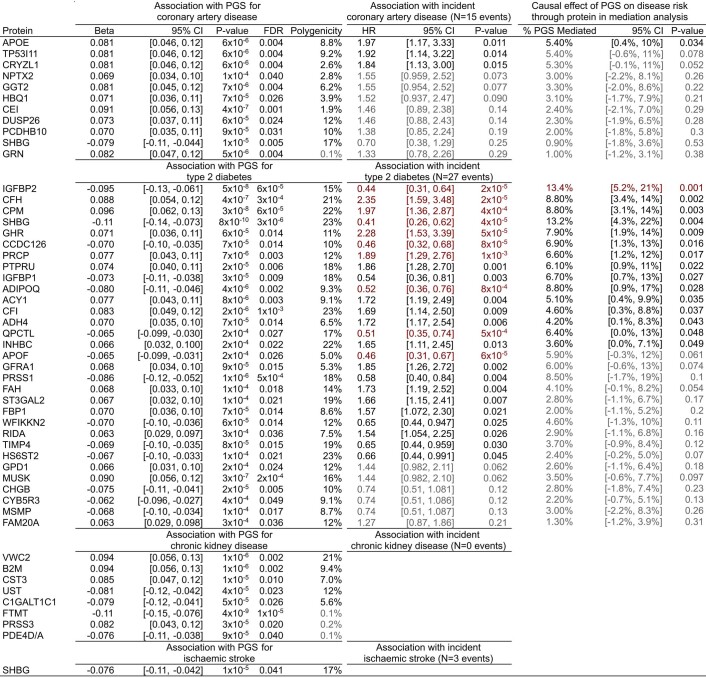
Extended Data Fig. 3. Summary statistics for PGS to protein to disease associations.
Beta: standard deviation change in protein levels per standard deviation increase in PGS (from Fig. 1b) in linear regression adjusting for age, sex, 10 genotype PCs, sample measurement batch, and time between blood draw and sample processing. FDR: Benjamini-Hochberg false discovery rate corrected P-value. FDR correction was applied separately for each PGS to all 3,438 P-values from linear regression of each of the 3,438 measured proteins on the respective PGS. Polygenicity: proportion of the genome (%) required to explain the PGS to protein association (from Fig. 1c). HR: hazard ratio for 7.7 year risk of hospitalisation with the respective disease conferred per standard deviation increase in protein levels (from Fig. 2b) in cox proportional hazard models using follow-up as time scale and adjusting for age, sex, sample measurement batch, and time between blood draw and sample processing. Associations highlighted in red indicate significant associations after Bonferroni correction for the 42 tests (P < 0.0012). Associations dulled in grey indicate P > 0.05. % PGS Mediated: Percentage of total association between the respective PGS and 7.7 year risk of hospitalisation with the respective disease mediated by the respective protein (from Fig. 2d). Highlighted in red indicates mediation was significant after Bonferroni correction for the 42 tests (P < 0.0012). Entries dulled in grey indicate P > 0.05. Linear regression, polygenicity, cox proportional hazard models, and mediation analysis were all performed in the same n = 3,087 independent INTERVAL participants. In each instance, 95% CI corresponds to the 95% confidence interval of the respective point estimate. All P-values are two-sided. 95% confidence intervals and P-values could not be formulated for the polygenicity tests. For proteins measured by more than one SomaLogic aptamer (GPD1, IGFBP1, IGFBP2, SHBG, and WFIKKN2) effect sizes were averaged and two-sided P-values were obtained from averaged Z-scores, and aptamer-specific summary statistics are detailed in Supplementary Table 3.

