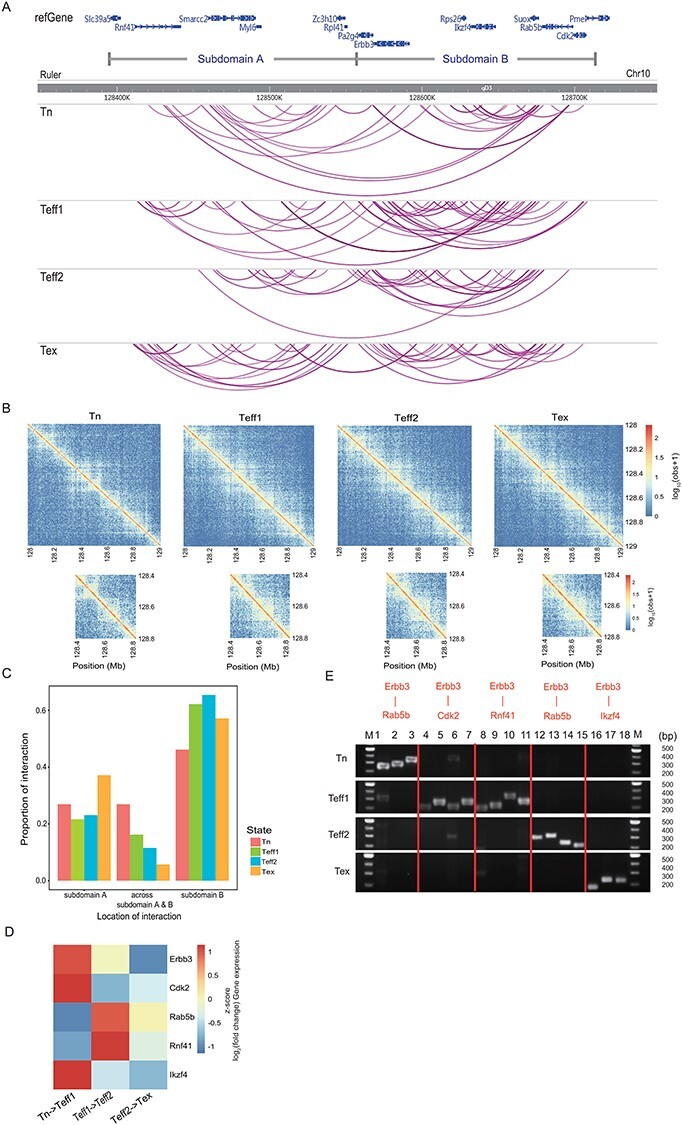
Figure 4 .

The PCR validation of Erbb3 involved interactions. (A) An overview of all interactions in the genomic region on chr10. The top panel shows the loci of genes involved in this region. We also separate this region into two potential subdomains A and B based on the changes in the proportion of interactions across these two subdomains, and the four panels below represent the distribution of all interactions detected in four samples in this region. Each purple line stands for an interaction. (B) Contact matrices demonstrate the log10 hybrid-fragment counts from the four Hi-C libraries at chr10: 128 000 000–129 000 000 at 5 kb resolution. (C) The proportion of interactions located in subdomain A, subdomain B and across these two subdomains in four samples. (D) Heat map depicts the scaled log2 fold change of averaged gene expression level. (E) PCR validation results of selected interactions. For each interaction detected by Chrom-Lasso, we captured the hybrid fragments surrounding the interacting loci from the Hi-C library and then designed primers based on the sequence of hybrid fragments for PCR. The result showed that the hybrid fragments are only detected in the corresponding Hi-C library, not in other Hi-C libraries.
