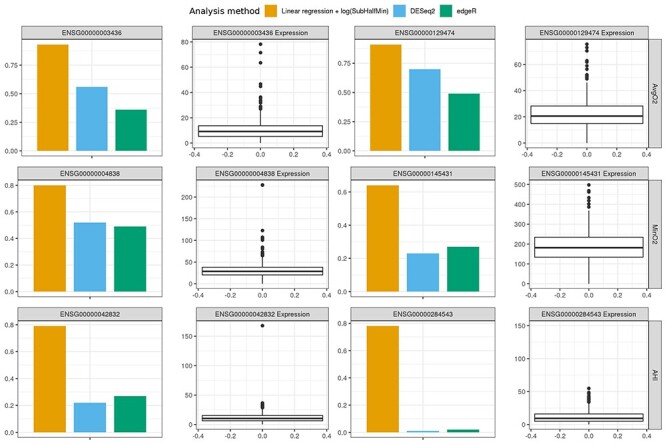
Figure 3 .

Estimated power for detecting a transcript simulated as associated with the three sleep traits when using Storey empirical P-values, and association is determined significant if its BH FDR-adjusted P-value is <0.05. The transcripts were randomly selected out of available transcripts (after filtering of transcripts with 50% or higher zero counts across the sample). We compared linear regression, DESeq2, and edgeR in transcriptome-wide association analysis for each of the sleep phenotypes. For each transcript used in simulations, we show both power and the box plot of its distribution in the sample after Median normalization.
