
Figure 4 .
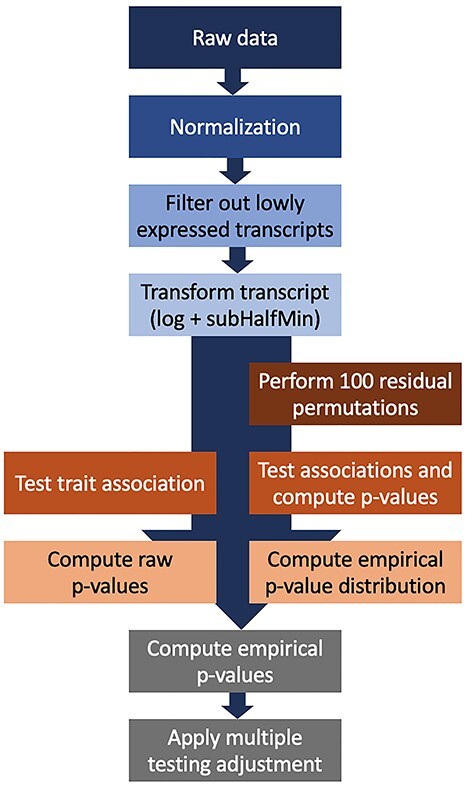
Analysis pipeline for association transcriptome-wide association analysis of continuous exposure phenotypes. The raw data are normalized using library-size normalization, followed by filtering of transcripts, transformation of transcript expression values, then single-transcript testing to obtain raw P-values. In parallel, residual permutation is applied under the null 100 times, and P-values are used to construct an empirical P-value distribution under the null, and to compute empirical P-values. Finally, the quantile empirical P-values are corrected for multiple testing.