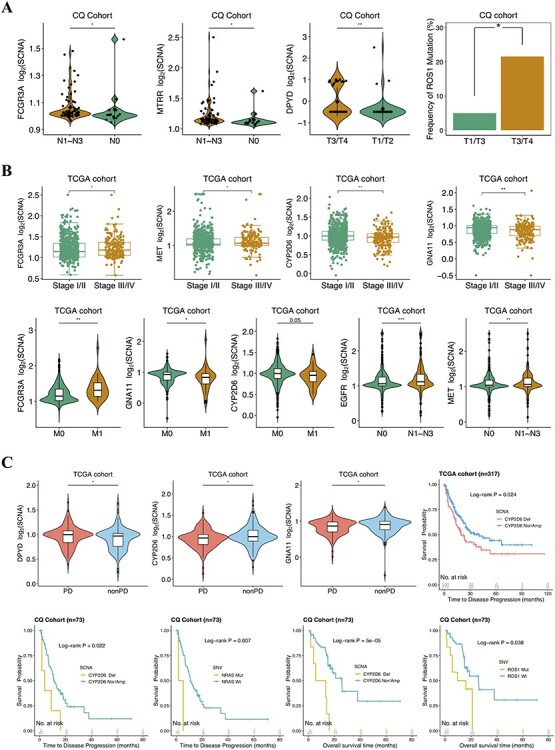
Figure 2 .

Selected clinical features associated with the implicated molecular alterations in CQ cohort (A) and TCGA cohort (B). (C) The detected copy numbers of DPYD, CYP2D6 and GNA11 at progression disease (PD) and nonprogression disease (non-PD) for TCGA (top left). Kaplan–Meier survival curves showing TTP analysis for CYP2D6 deletion in TCGA (top right) and CQ cohort (bottom left) as well as NRAS mutation in CQ cohort (bottom left); OS analysis for CYP2D6 deletion and ROS1 mutation (bottom right) in CQ cohort. Del: deletion; Nor/Amp: normal/amplification; Mut: mutant; Wt: wild-type.
