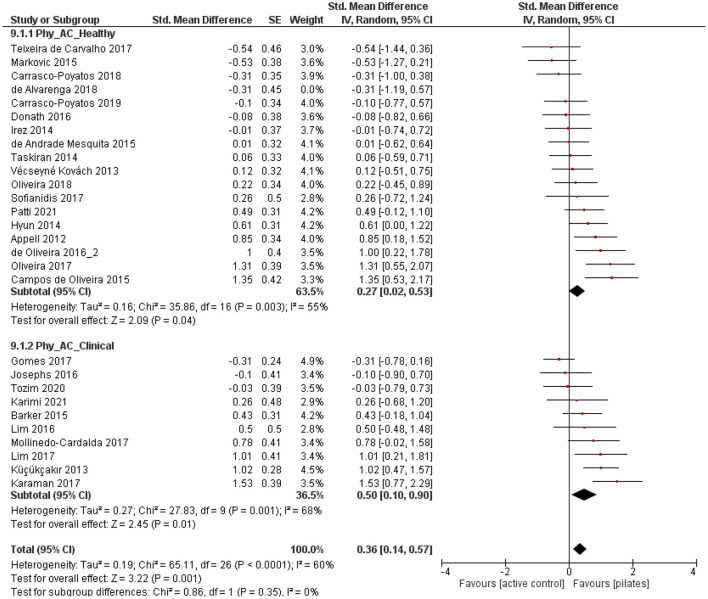
Figure 6.
Forest plot of standardized mean effects of Pilates intervention on physiological health parameters compared to active control (AC) groups. Data are presented for healthy older adults and older adults with clinical conditions. SE, standard error; IV, inverse variance model; CI, confidence interval; Std., standardized.

