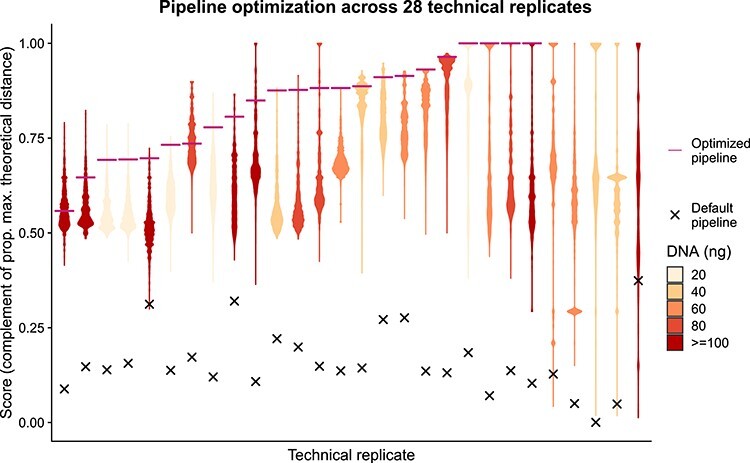
Figure 3 .

Empirical optimization of the variant postprocessing algorithm. Each violin plot summarizes the distribution of optimization scores of 5 308 416 combinations of values of the 13 parameters that control the pipeline for one of the 28 technical replicates (same DNA sample processed twice independently). The optimization score indicates the two-dimensional euclidean distance to the theoretical optimum value of similarity between technical replicates (1) and proportion of final common variants that have a population allele frequency below 0.05 (1) relative to the maximum possible distance. After parameter optimization the similarity between the technical replicates was on average 88%, range 0–100% (x = score before optimization; —: score after optimization; colors indicate the amount (ng) of DNA used as template).
