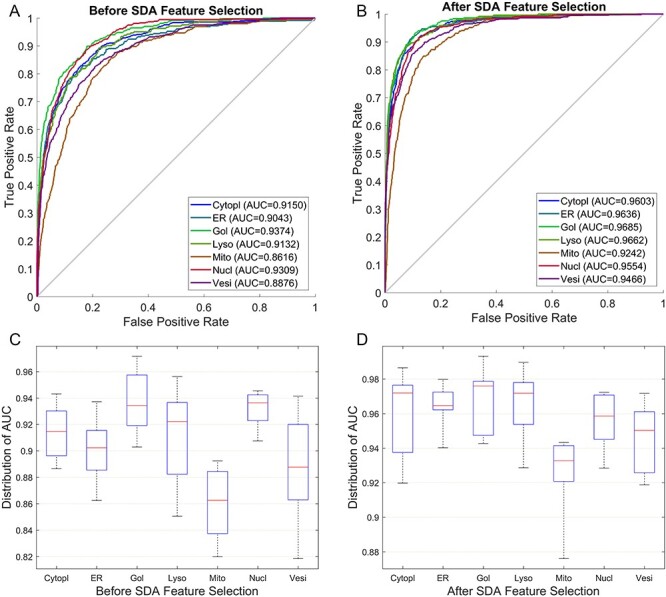
Figure 5 .

Performance comparison between the Har pure feature set and the Har optimal feature set under the SVM-RBF model: (A) ROC curves of the Har pure feature set; (B) ROC curves after applying the SDA feature selection method; (C) Distribution of AUC values of the Har pure feature set and (D) Distribution of AUC values after applying the SDA feature selection technique.
