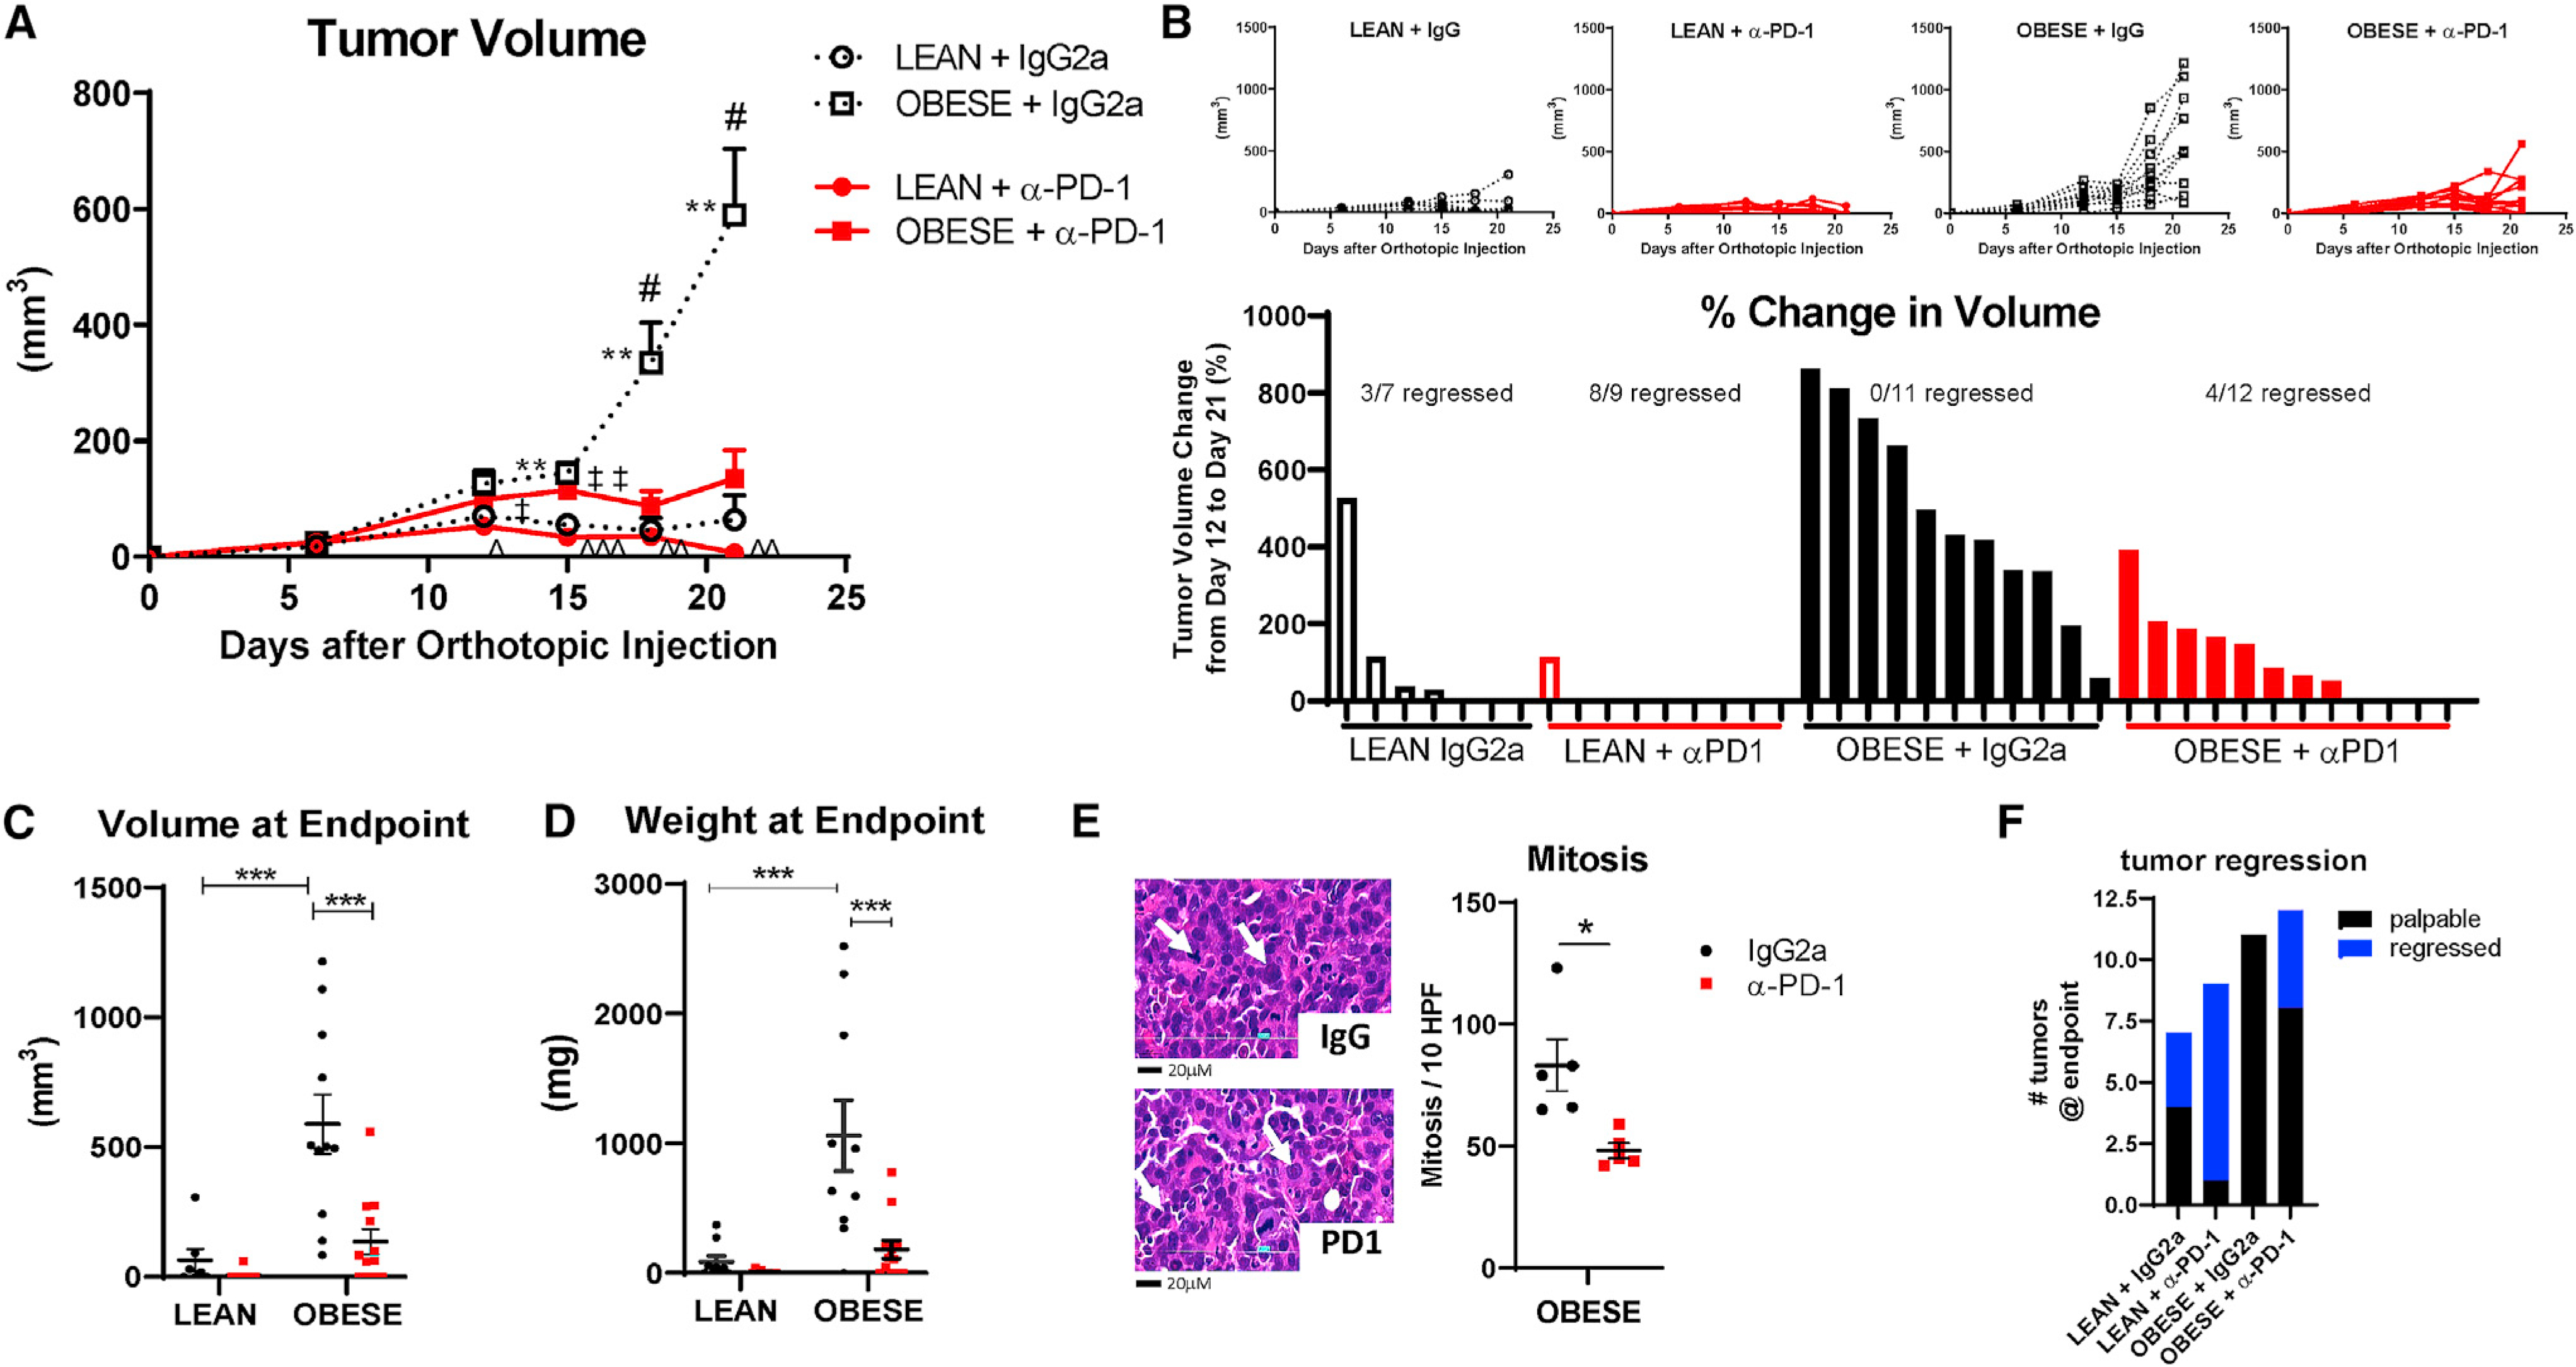
Figure 1. Obesity-accelerated BC progression is reduced with immune checkpoint blockade.

(A) E0771 tumor progression was measured by digital caliper over three weeks after orthotopic injection. Two-way ANOVA repeated measures with Tukey post hoc test was calculated in GraphPad Prism. #p < 0.05, obese IgG2a versus anti-PD-1; **p < 0.01, lean versus obese IgG2a; ˆp < 0.05, ˆˆp < 0.01, and ˆˆˆp < 0.001, lean anti-PD-1 versus obese IgG2a; and ‡p < 0.05 and ‡‡p < 0.01, lean versus obese anti-PD-1. n = 9–12.
(B) Tumor progression in individual mice in each diet and treatment group from (A). The percentage of change in tumor volume is shown below each rank-sorted treatment group. The number of mice with regressed tumors is shown out of the total.
(C) Tumor volume at the endpoint.
(D) Tumor weight at the endpoint. ***p < 0.001 by two-way ANOVA with Tukey post hoc test. n = 9–12.
(E) Number of mitosis per 10 high-power fields (HPFs) in obese tumors was quantified. *p = 0.013 by Student’s t test, n = 3–4. Representative H&E images of mitotic nuclei are indicated by the white arrow. Scale bar is 20 μM.
(F) Number of regressed (undetectable) tumors compared with total palpable tumors at the endpoint.
Data are shown as mean ± SEM for all images, except for (B) and (F). See also Figure S1.
