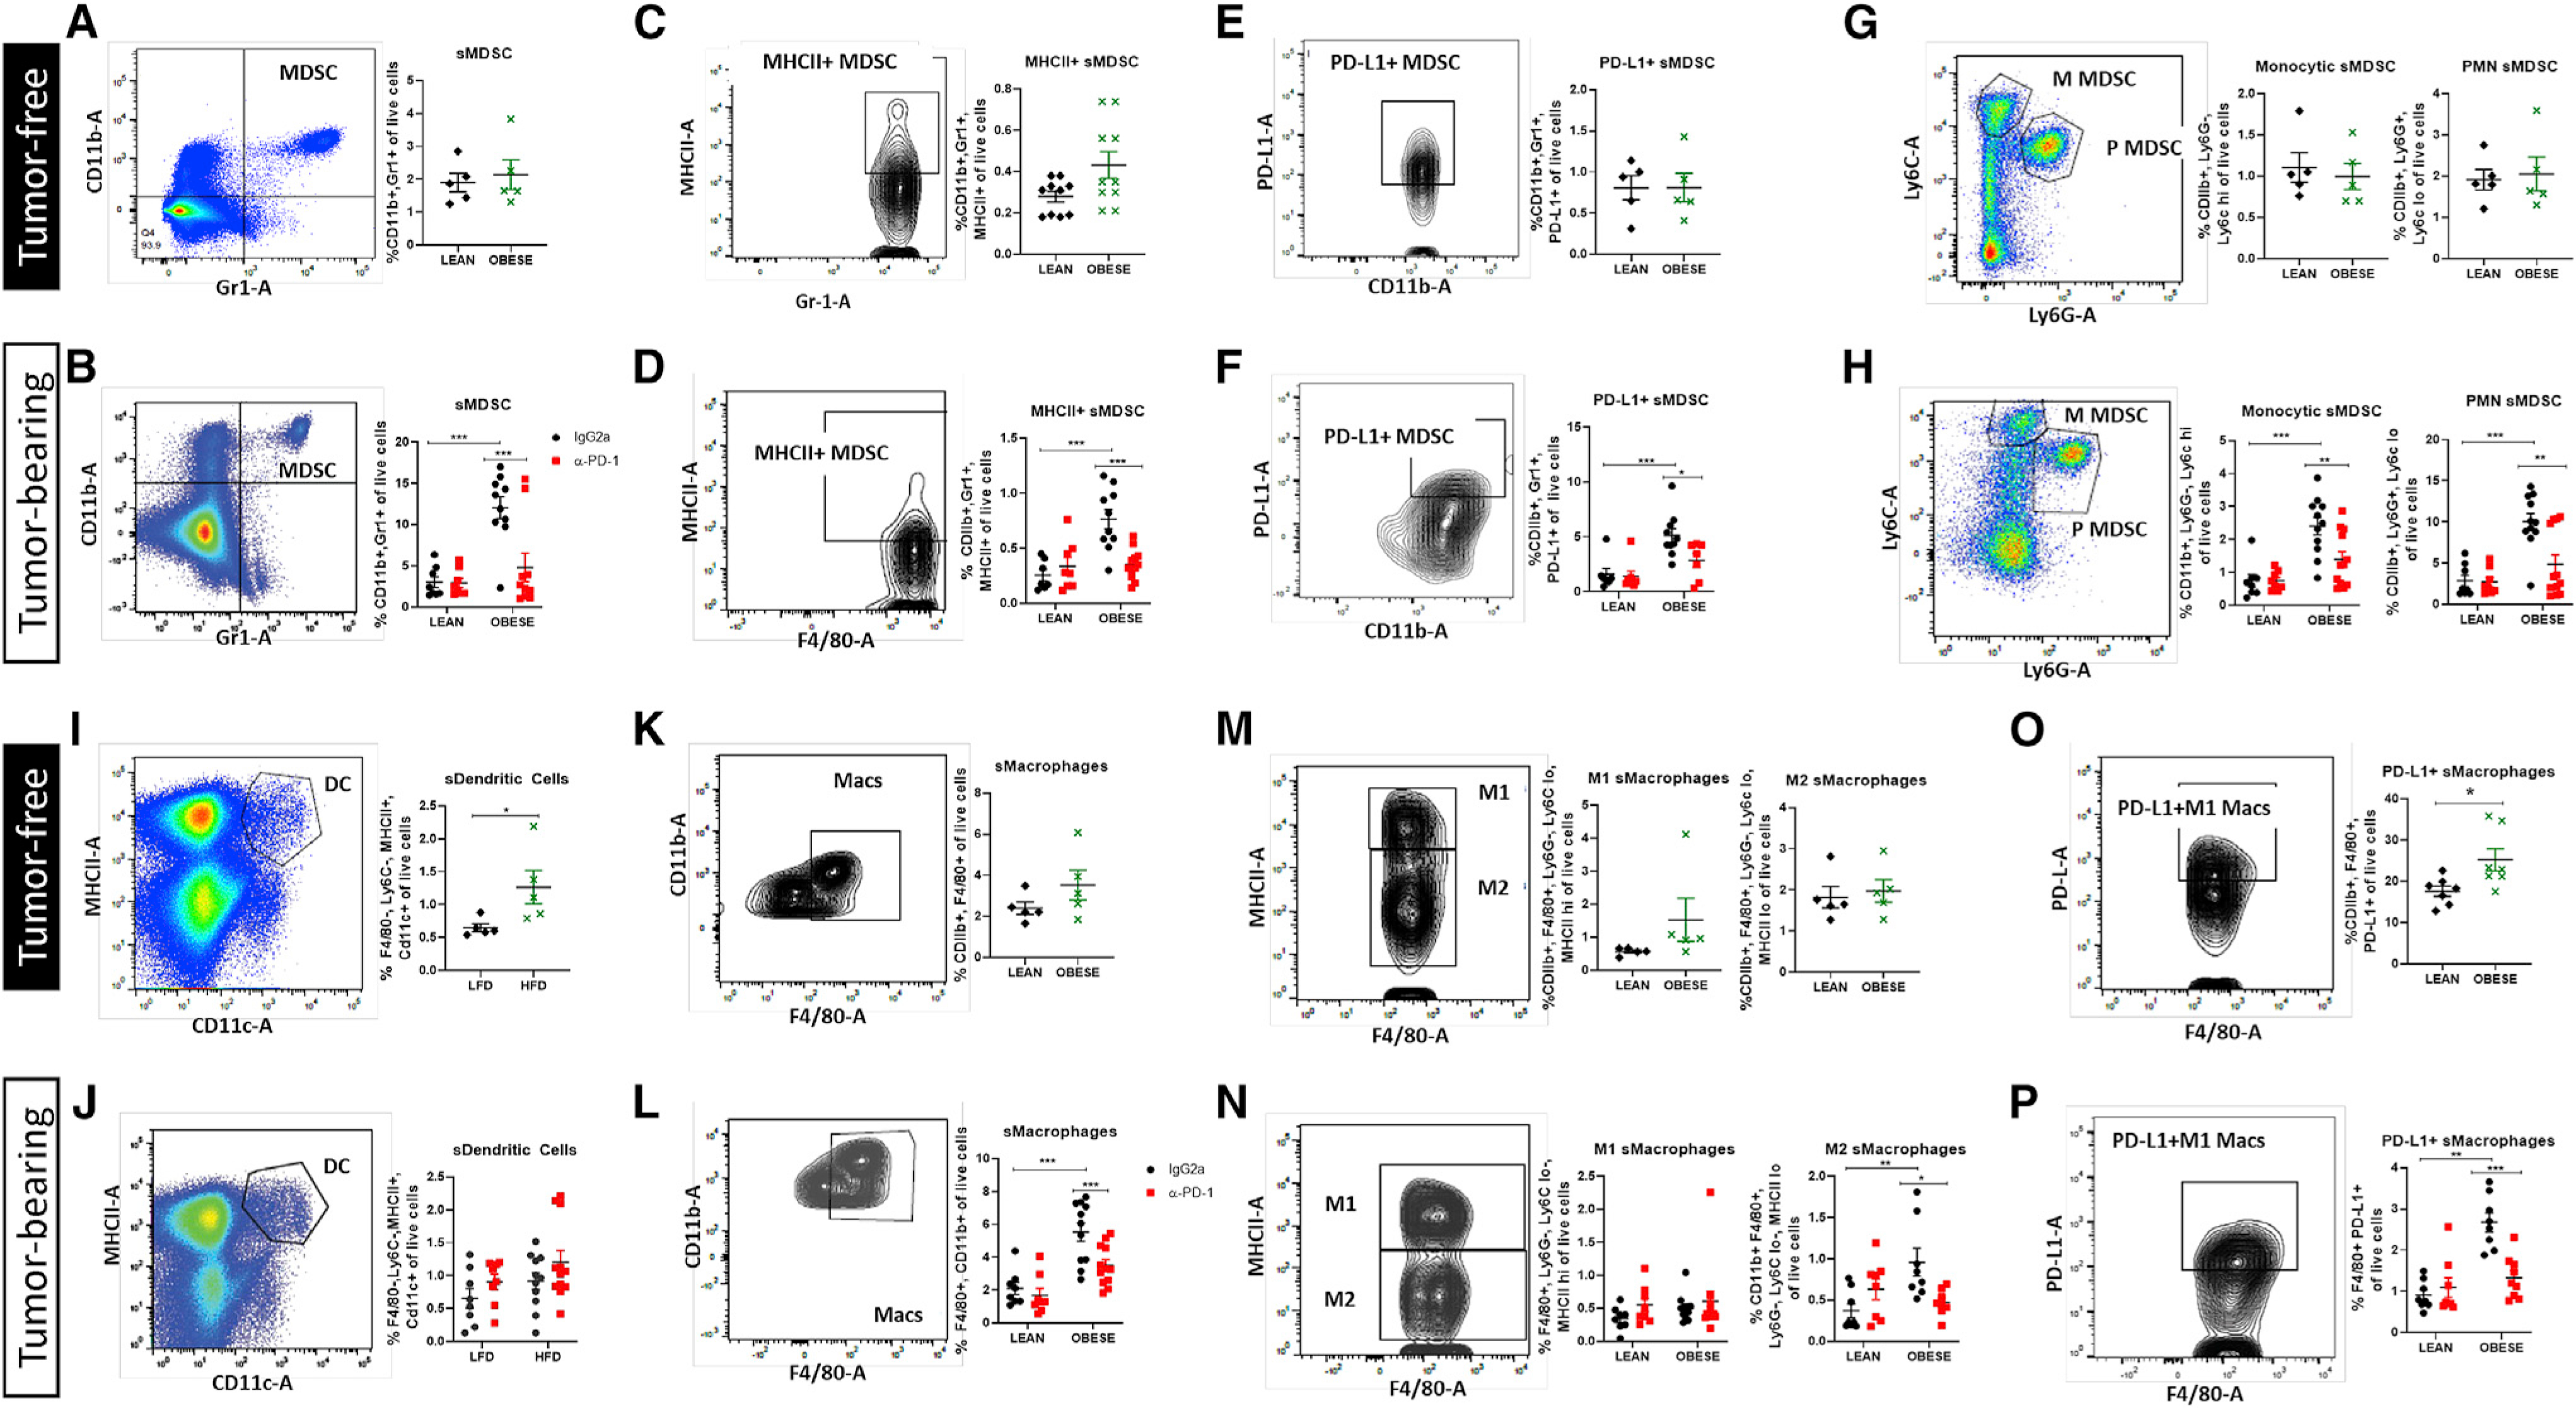
Figure 4. Immune checkpoint blockade reprograms immunosuppressive splenic immune cells induced by obesity.

Flow cytometric analysis of spleens from lean and obese tumor-free mice (black diamond and green X) and lean and obese tumor-bearing mice treated with IgG2a or a-PD-1 (black circle and red square) is presented.
(A and B) Splenic myeloid-derived suppressor cells (sMDSCs).
(C–F) sMDSCs positive for MHCII (C and D) or immune checkpoint PD-L1 (E and F).
(G and H) Monocytic (M) and polymorphonuclear (PMN, P) subtypes of sMDSCs.
(I and J) Splenic DCs (sDCs).
(K and L) Splenic Macs (sMacs).
(M and N) M1-like and M2-like sMac subtypes.
(O and P) Frequency of PD-L1+ sMacs.
Data are shown as mean ± SEM. *p < 0.05, **p < 0.01, and ***p < 0.001 by two-way ANOVA. n = 8–10. See also Figure S2B.
