
Figure 6. The gut microbiome is affected by tumor and anti-PD-L1 therapy.
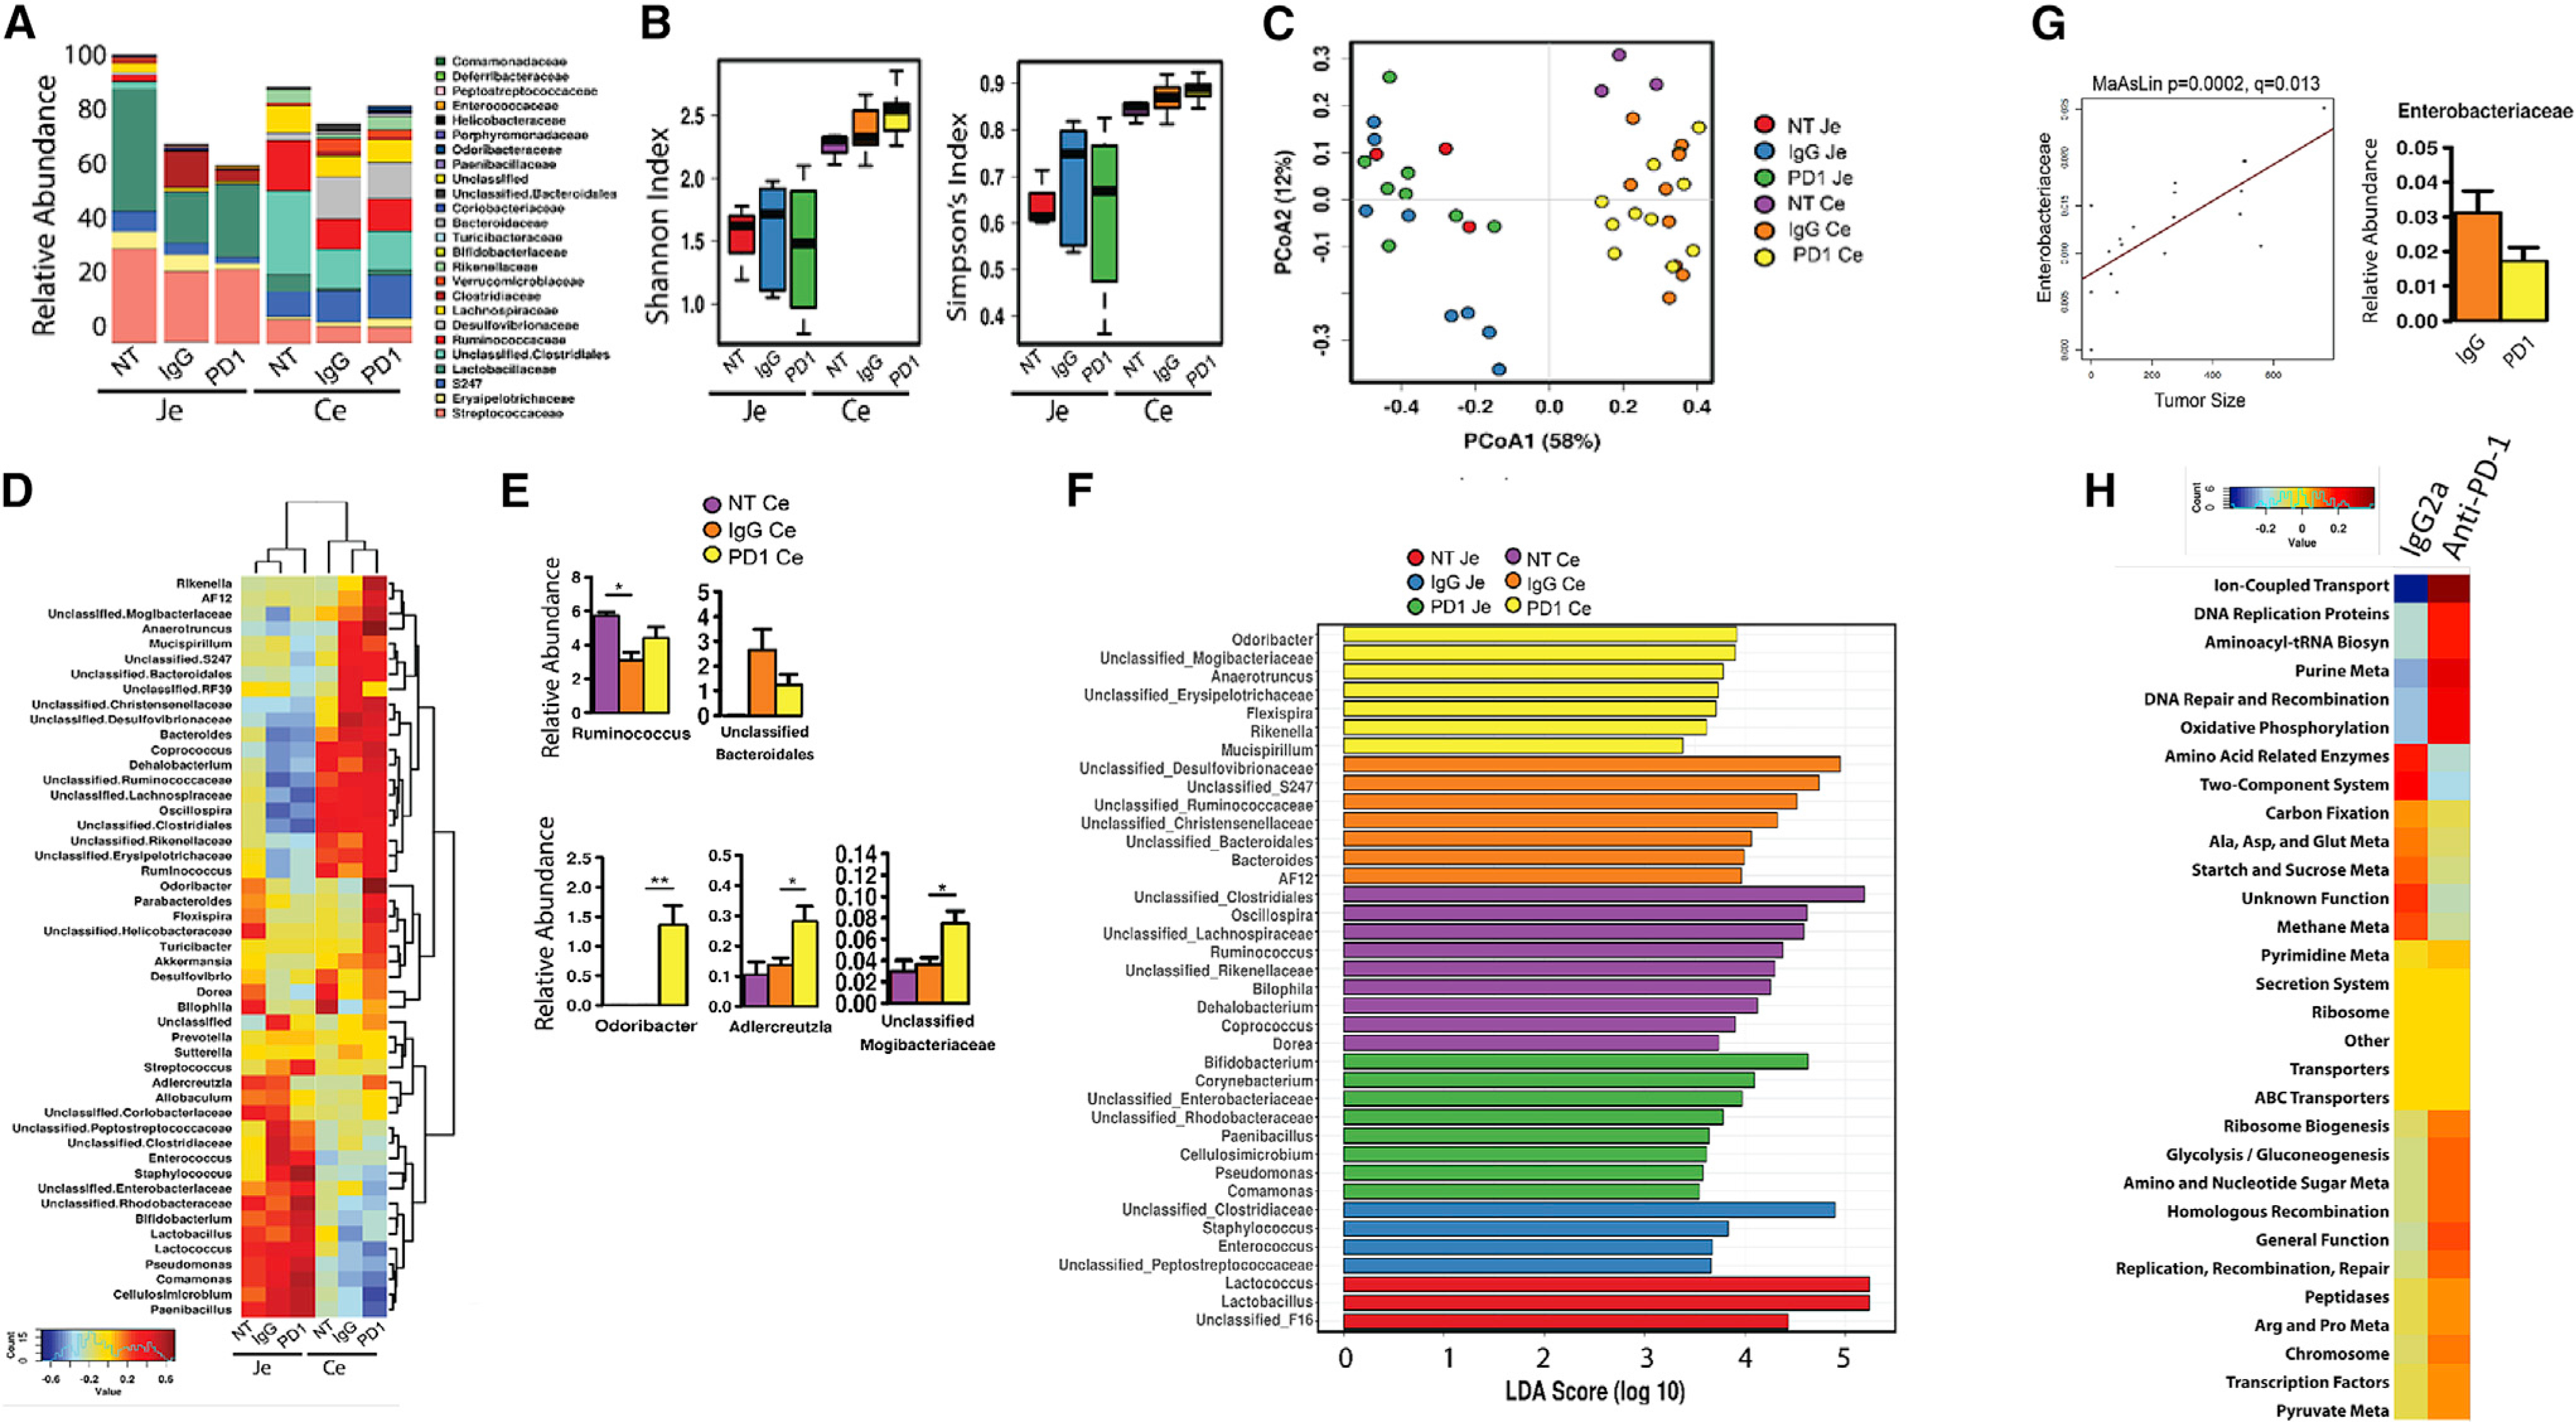
Fecal contents were isolated from the jejunum (JE) or cecum (CE) at sacrifice from obese tumor-free (no tumor [NT]) mice or obese mice with E0771 tumors treated with IgG2a control or anti-PD-1 as above.
(A) Relative abundance of taxonomic composition at the family level.
(B) Alpha diversity by Shannon and Simpson indices.
(C) Beta diversity calculated by Bray-Curtis analysis and displayed as principal coordinate analysis (PCoA). Permutational multivariate analysis of variance (PERMANOVA), R2 = 0.614, p = 0.0003; analysis of similarity (Anosim), R = 0.631, p = 0.001; analysis of multivariate homogeneity of group dispersions (PERMDISP2), p = 0.0026.
(D) Heatmap of the 50 most abundant microbial taxa as calculated by Spearman’s rank correlation coefficient. Dendrograms display group and taxa clustering.
(E) Select species shown for CE taxa altered by IgG2a and anti-PD-1 therapy compared with tumor-free mice (NT). Mean ± SEM of relative abundance is shown. *p < 0.05 and **p < 0.01 by two-way ANOVA.
(F) Linear discriminant analysis (LDA) effect size (LEfSe) by genus for JE and CE.
(G) Tumor size (volume) at the endpoint was correlated with cecal microbial community relative abundance using MaAsLin. Enterobacteriaceae is shown (p = 0.0002, q = 0.013). The graph on right is the relative abundance in CE.
(H) Heatmap of the 30 most abundant phylogenetic Investigation of Communities by Reconstruction of Unobserved States (PICRUSt) predicted metabolic pathways calculated by Spearman’s rank correlation coefficient in CE. *p < 0.05, **p < 0.01, and ***p < 0.001.
n = 8–10. See also Figure S6.