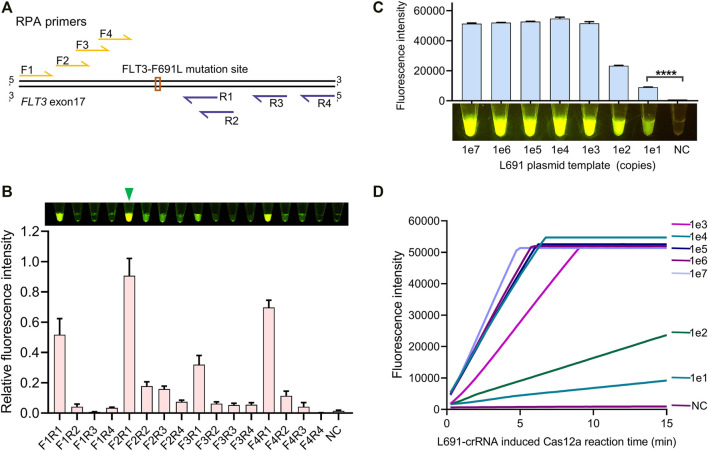
FIGURE 3.
RPA primer screen for highly sensitive detection. (A) Relative locations of RPA primers to the FLT3-691 site. Forward and reverse primers are colored in yellow and purple, relatively. (B) Comparison of amplification efficiency between different RPA primer pairs. The naked-eye results and fluorescence intensity results are shown above and below, respectively. The relative fluorescence intensity is normalized by setting the highest value to 1. A green triangle points out the most efficient F2R1 pair. (C) The identification of the amplification capacity of F2R1-mediated RPA using 1e7 ∼ 1e1 gradient copies of L691 plasmid templates. This assay was conducted by 15 min of RPA and 15 min of L691-crRNA induced Cas12a reaction, both under 37°C. The fluorescence intensity results and the naked-eye results are shown above and below, respectively. (D) Time-course analysis of (C).

