FIGURE 5.
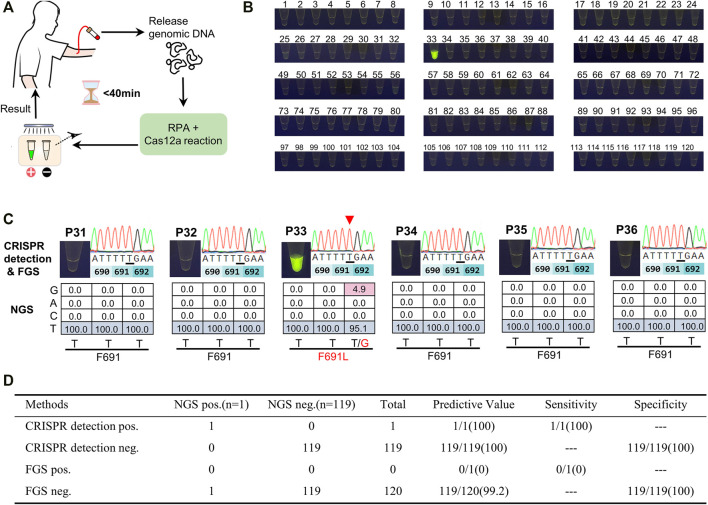
Screening of AML samples for FLT3-F691L mutation by CRISPR detection. (A) Schematic diagram of the whole mutation detection process. (B) Detection results of 120 AML patients using CRISPR detection for FLT3-F691L mutation. P33 is a FLT3-F691L positive sample. (C) The CRISPR detection, FGS, and NGS results of P33 and other five FLT3-F691L negative patients. In FGS results, mutation base is underlined and pointed out by a red triangle. In NGS results, WT and mutation bases are colored in blue a red, respectively. (D) Statistical table of the sensitivity and specificity of CRISPR detection compared with FGS, using NGS as a standard reference.

