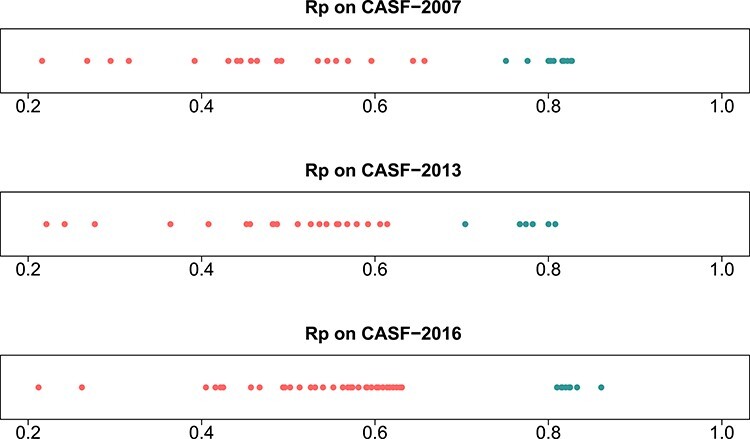
Figure 1 .

Performance of classical SFs (red dots) and ML-based SFs (green dots) on three CASF benchmarks. Each dot represents a SF. For instance, on CASF-2016 the best classical SF (i.e. X-Score) and the best ML-based SF (i.e. TopBP) obtained an Rp of 0.631 and 0.861, respectively. The raw values of this figure can be found in Supplementary Tables S1–S3.
