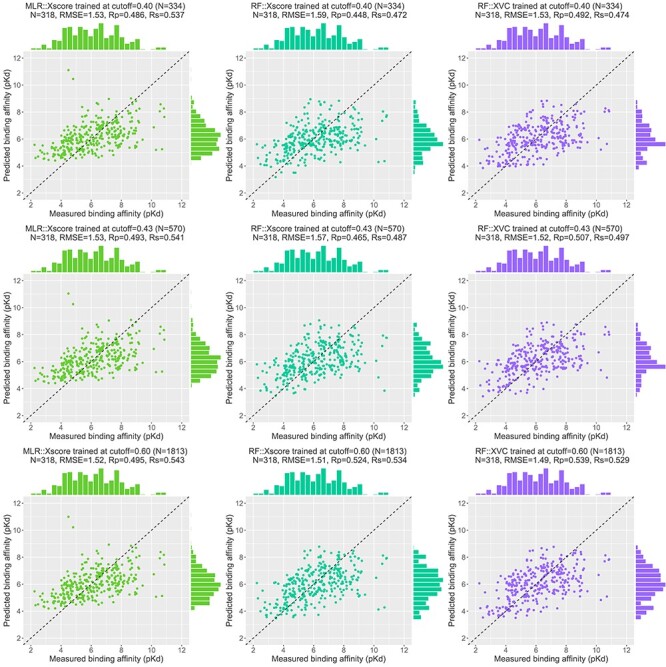
Figure 15 .

Scatter plots of predicted and measured binding affinities on Blind-2018 (N = 318 test complexes). Three SFs are compared: MLR::Xscore (left column), RF::Xscore (center column) and RF::XVC (right column), trained at three different cutoffs: 0.40 (1st row), 0.43 (2nd row) and 0.60 (3rd row), corresponding to 334, 570 and 1813 training complexes, respectively. The cutoff 0.40 represents the initial low end where MLR::Xscore resulted in a lower RMSE than RF::Xscore and RF::XVC. The cutoff 0.43 is the crossing point where RF::XVC started to generate lower RMSE values than MLR::Xscore. The cutoff 0.60 is another crossing point where RF::Xscore started to outperform MLR::Xscore in terms of RMSE.
