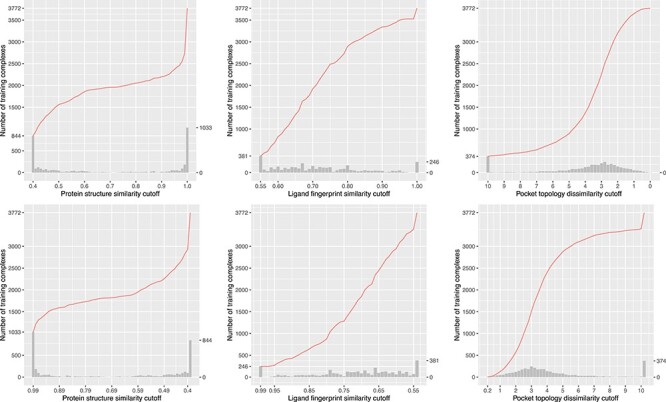
Figure 6 .

Number of training complexes (the red curve) against protein structure similarity cutoff (left column), ligand fingerprint similarity cutoff (center column) and pocket topology dissimilarity cutoff (right column) to the CASF-2016 test set in two directions, either starting from a small training set comprising complexes most dissimilar to the test set (top row; the ds direction defined by  or
or  ) or starting from a small training set comprising complexes most similar to the test set (bottom row; the sd direction defined by
  or
or  ). At the top row, the histograms plot the number of additional complexes that will be added to a larger set when the protein structure similarity cutoff is incremented by a step size of 0.01 (left), when the ligand fingerprint similarity cutoff is incremented by 0.01 (center), or when the pocket topology dissimilarity cutoff is decremented by 0.2 (right). At the bottom row, the histograms plot the number of additional complexes that will be added to a larger set when the protein structure similarity cutoff is decremented by a step size of 0.01 (left), when the ligand fingerprint similarity cutoff is decremented by 0.01 (center), or when the pocket topology dissimilarity cutoff is incremented by 0.2 (right). Hence the number of training complexes referenced by an arbitrary point of the red curve is equal to the cumulative summation over the heights of all the bars of and before the corresponding cutoff. By definition, the histograms of the three subfigures at the bottom row are identical to the histograms at the top row after being mirrored along the median cutoff, but the cumulative curves are certainly different. The raw values of this figure are available at https://github.com/cusdulab/MLSF.
