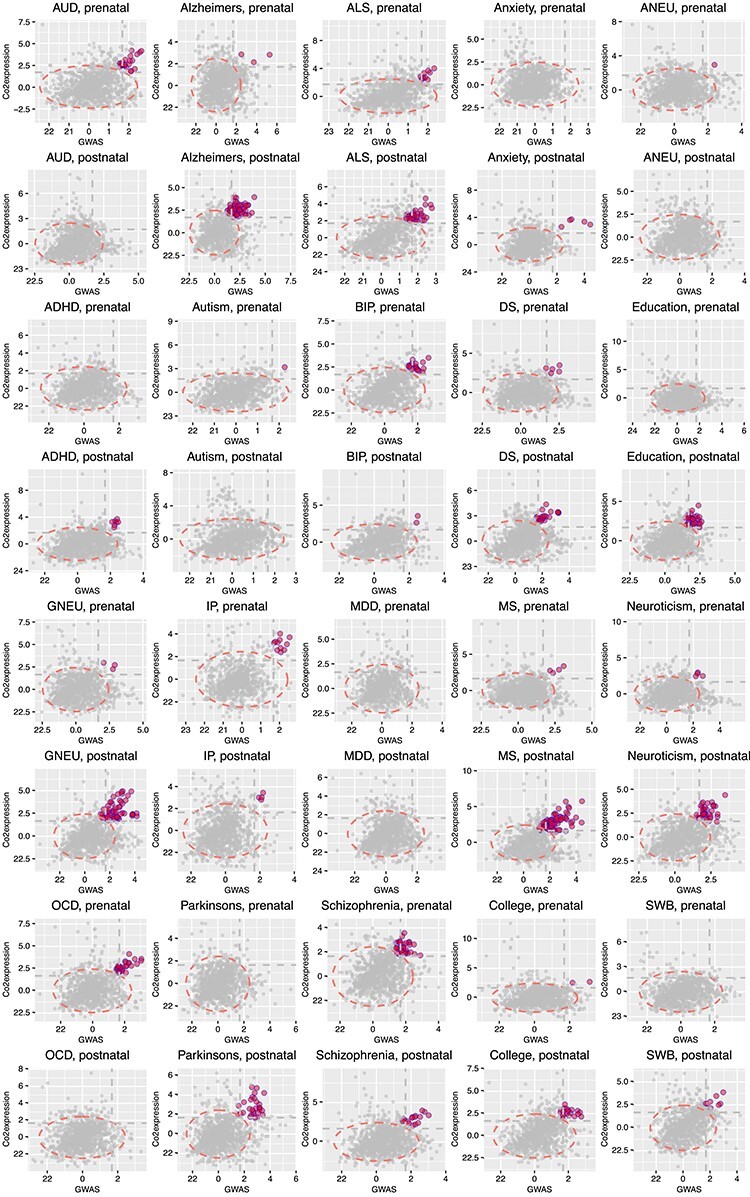
Figure 3 .

tpGWAS revealed different patterns of module distribution in 20 brain-related disorders or traits. In each panel, a dot represents a module. The x-axis is the normalized node score from  , which is calculated using gene-based P-value from GWAS. The y-axis is the normalized edge score from
  , which is calculated using gene co-expression. Normalization was conducted using random modules, which are not shown in the figure, but the 95% confidence interval estimated by using random modules is shown as the red eclipse. Color dots indicate significant modules selected to define module genes. The horizontal and vertical gray dash lines indicate where x = 1.68 or y = 1.68 (95% of modules having the scores below the line). ANX, anxiety; COL, college.
