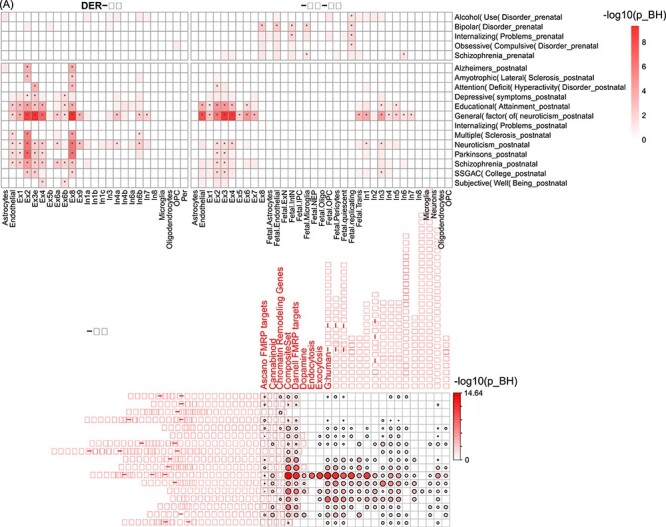
Figure 5 .

Enrichment analysis of module genes using cell type expression and functional annotations. (A) Cell type-specific enrichment analysis using two panels of brain scRNA-seq data (DER-22 and DER-20). (B) Functional enrichment of module genes (rows) using curated gene sets (columns) previously shown to be involved in brain disorders. The color of each cell is proportional to −log10(PBH).
