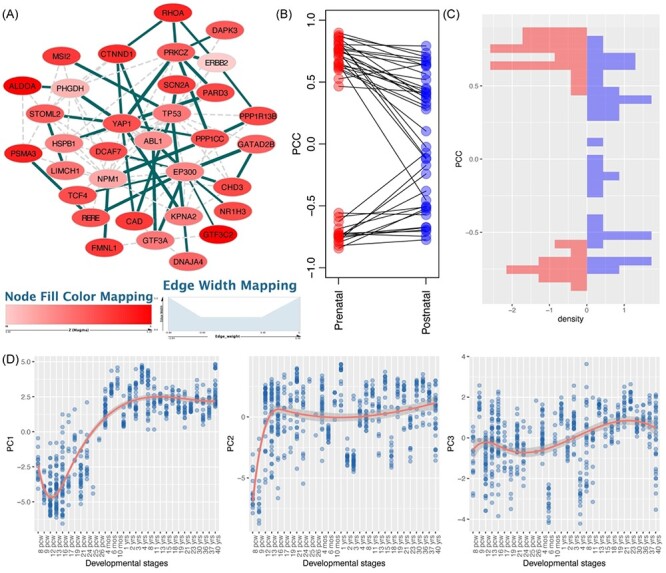
Figure 6 .

AUD-associated network and features of module genes. (A) Network visualization of AUD module genes identified in prenatal transcriptome. Blue edges indicate those involved in the identified modules, while gray edges are only connected using the reference interactome. Node color is proportional to the gene-based P-value. Edge width is proportional to the absolute PCC value in the prenatal stage. Gray edges are not involved in the discovery of modules. (B-C) Distribution of module gene interactions (edge scores) in prenatal (left panel) and postnatal (right panel) data. These interactions show consistent high co-expression in prenatal stage in both the discovery and validation datasets, but such a pattern is not observed in the postnatal stage in either the discovery or the validation dataset. (D) The first three principal components (PCs) of the module genes and their trajectory expression across the whole developmental stage.
