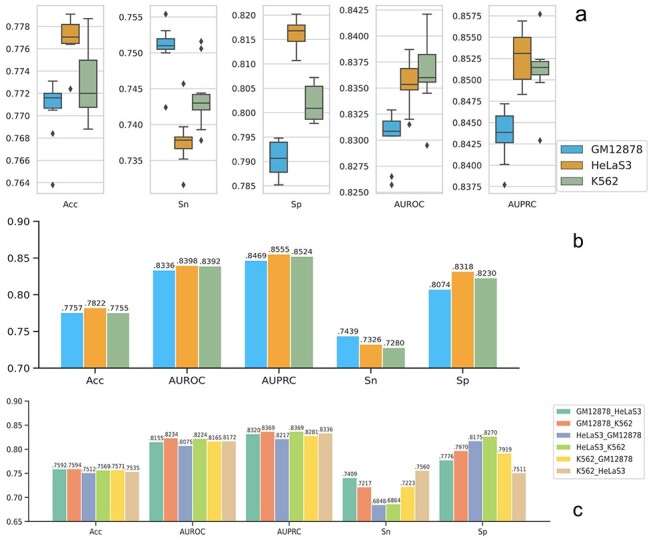
Figure 3 .

The prediction results in verified transcript prediction. Sn (sensitivity) represents the positive prediction accuracy and Sp (specificity) represents the negative prediction accuracy; y-axis represents the corresponding values for each evaluation criteria; (A) 10-fold validation. The box and whisker plot here shows the spread and centers of the 10-fold validation results. The five horizon lines from bottom to top represent minimum (the smallest number in the data set), the first quartile, the median, the third quartile and the maximum (the largest number in the data set), respectively. (B) Cross chromatin split validation. (C) Cross cell line validation.
