
Figure 3 .
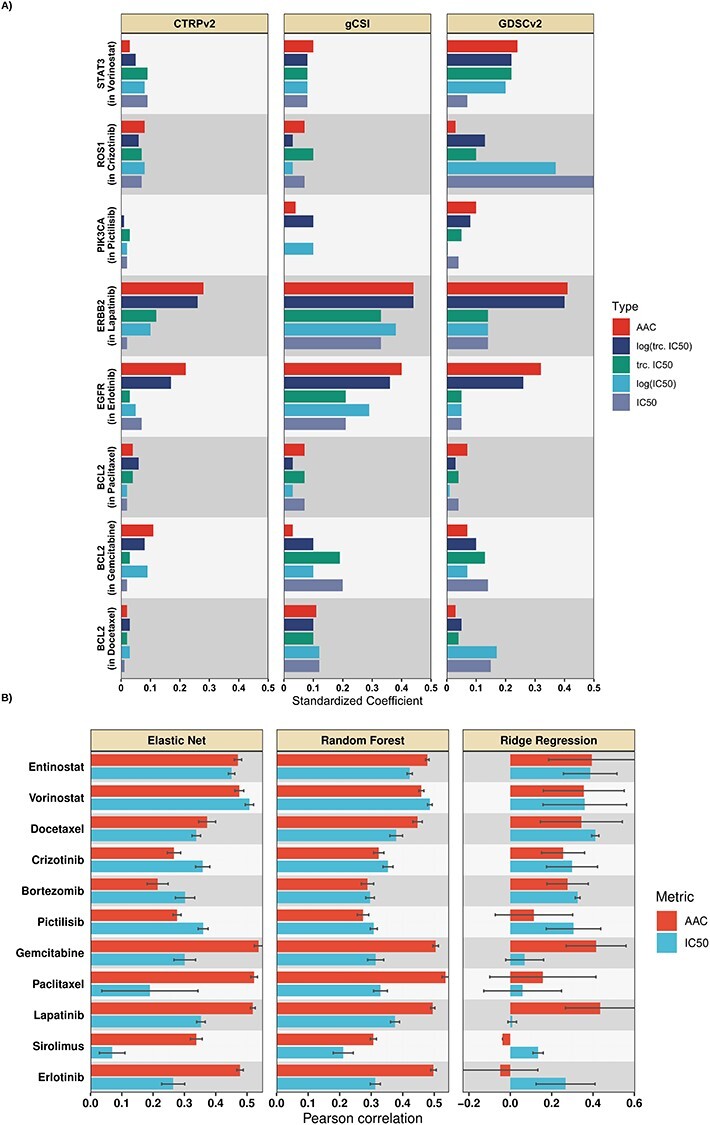
(A) Comparison of AAC (red) to different approaches of preprocessing IC50 via univariable analysis, tested on selected prospective biomarkers of the studied drugs in terms of the standardized coefficients. A single prospective biomarker per drug is shown (generally the marker with the strongest association), full results are available in supplementary data. (B) Mean Pearson correlation (over 10 runs) for different multivariable methods in within-domain analysis trained to predict AAC or log-truncated log-truncated IC50. Multivariable within-domain analysis results indicated that AAC outperforms IC50 on average.