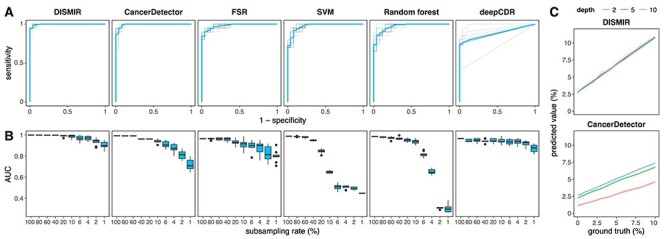
Figure 2 .

Results of DISMIR and other methods on HCC diagnosis. (A) ROC curves of different HCC diagnosis methods in the test cohort. Blue lines show the average of the ROC curve. Each method was performed for 10 times with random partition of training and test samples. (B) AUCs of different HCC diagnosis methods at different subsampling rates. Each condition was performed for 10 times with randomly subsampling in the test cohort. (C) Simulation results at different depths with DISMIR (top) and CancerDetector (bottom). Each condition was performed for 10 times with randomly sampling and mixing. For each graph, CancerDetector denotes the method following the principle of the CancerDetector paper; deepCDR denotes the deep learning model with the same structure as DISMIR trained with reads from the CancerDetector-identified DMRs.
