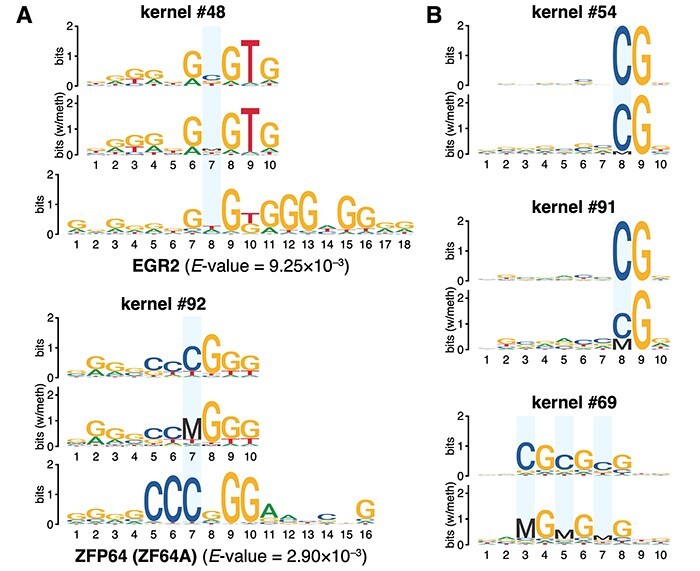
Figure 3 .

Visualized convolution kernels of the deep learning model. (A) Visualized kernels matched to known HCC-related motifs. (B) Visualized kernels focusing on the methylation state of CpG sites. Cytosines at CpG sites are marked with blue rectangles.
