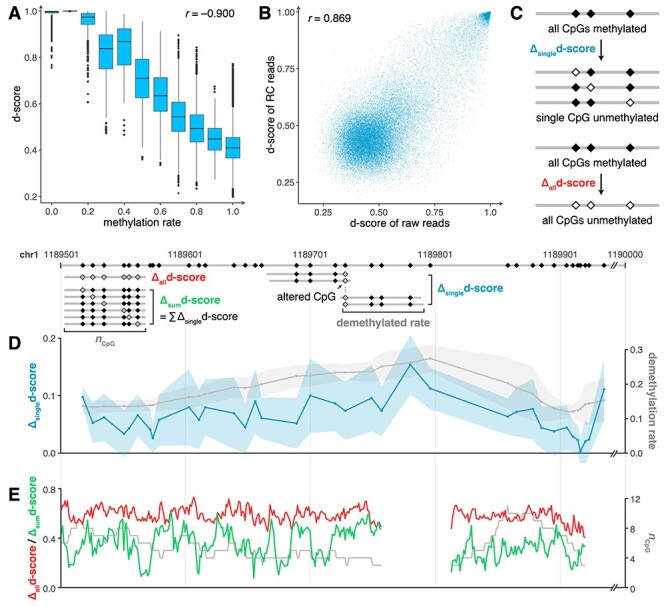
Figure 4 .

The joint pattern of DNA sequence and methylation decides the prediction of DISMIR. (A) The relationship between methylation rates and d-scores of all reads. (B) The relationship of d-scores of raw reads and their RC reads. (C) The schematic diagram depicting how reads with altered methylation states were generated for downstream analysis. (D) Δsingled-score (blue line) and the corresponding demethylation rate (gray line) at different positions in the selected switching region. Colored shadows show the standard deviation of Δsingled-score. (E) Δalld-score (red line), Δsumd-score (green line) and the corresponding CpG count (gray line) at different positions in the selected switching region.
