
Figure 1.
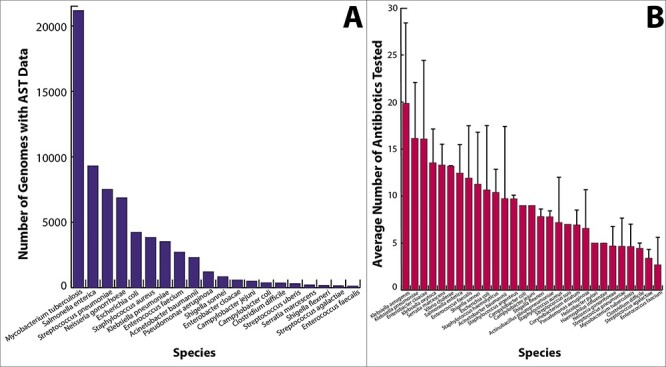
Histograms depicting (A) the number of genomes for the top organisms in the AST data collection, and (B) the average number of antibiotics tested per isolate. Whisker bars depict the standard deviation.
Official websites use .gov
A
.gov website belongs to an official
government organization in the United States.
Secure .gov websites use HTTPS
A lock (
) or https:// means you've safely
connected to the .gov website. Share sensitive
information only on official, secure websites.
Histograms depicting (A) the number of genomes for the top organisms in the AST data collection, and (B) the average number of antibiotics tested per isolate. Whisker bars depict the standard deviation.