
Figure 2.
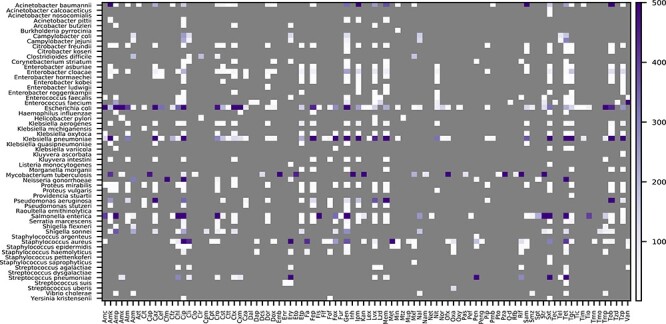
Counts of susceptible and resistant isolates with sequenced genomes for each species and antibiotic in the AST data collection. The category (susceptible or resistant) with fewer genomes is depicted. The color scale is capped at 500 genomes. Antibiotic abbreviations are defined in Table S2. Unnamed species with a ‘sp.’ designation are not shown.