
Figure 3.
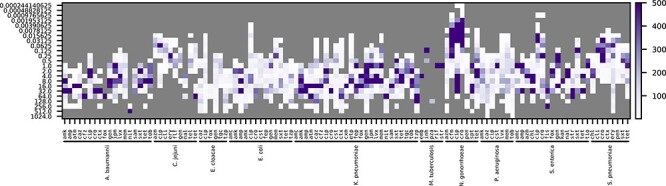
Counts of sequenced isolates with a given MIC for each species and antibiotic in the AST data collection. MICs are shown on the left. The color scale is capped at 500 genomes. Antibiotic abbreviations are defined in Table S2.
Official websites use .gov
A
.gov website belongs to an official
government organization in the United States.
Secure .gov websites use HTTPS
A lock (
) or https:// means you've safely
connected to the .gov website. Share sensitive
information only on official, secure websites.
Counts of sequenced isolates with a given MIC for each species and antibiotic in the AST data collection. MICs are shown on the left. The color scale is capped at 500 genomes. Antibiotic abbreviations are defined in Table S2.