
Figure 5.
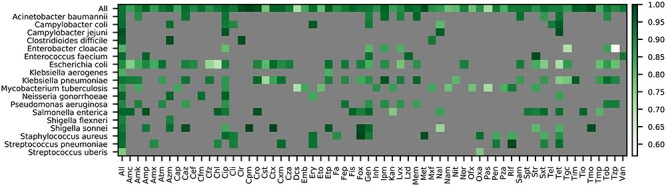
F1 scores for an XGBoost model built to classify susceptible and resistant phenotypes. One model was built using nucleotide 7-mers as input features for all species with at least 75 susceptible and resistant genomes. The coloring depicts the F1 score for each antibiotic-species combination based on a 5-fold cross-validation. The ‘All’ category depicts the average F1 score for each species and antibiotic, respectively. Antibiotic abbreviations are defined in Table S2.