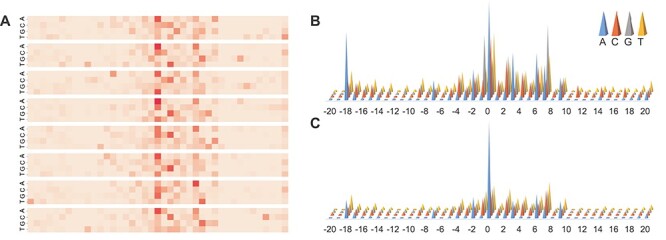
Figure 5.

Illustration of the attention matrix of AL6mA for predicting 6mA sites of A. thaliana. It consists of (A) heatmap of key areas for a single input sequence; (B) attention matrix for TPs and (C) attention matrix for TNs. The darker colors in the heatmap indicate larger values in the attention matrix, whereas lighter colors denote the opposite. The height of the cones in B and C is proportional to the contribution to the prediction.
