Figure 7.

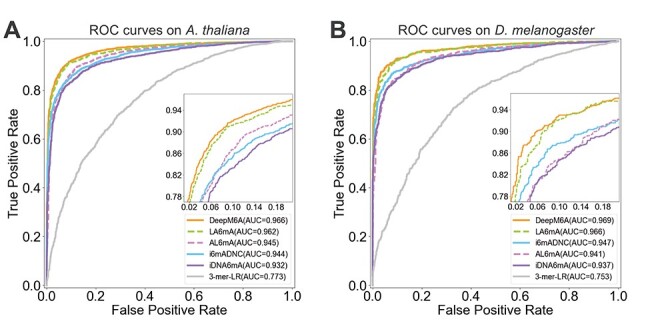
ROC curves of different methods for 6mA prediction on the two organisms: (A) ROC curves on A. thaliana and (B) ROC curves on D. melanogaster.

ROC curves of different methods for 6mA prediction on the two organisms: (A) ROC curves on A. thaliana and (B) ROC curves on D. melanogaster.